
Some institutions, including endowments and foundations, face the need to pay out capital on a regular basis to support the organization’s mission. While put selling can deliver equity-like returns over the long term, in these cases the interaction of spending policies and investment policies raise the question of the suitability of put writing strategies in cases where regular payouts are required.
In our analysis at GMO, we compared the payout profile of put writing to long-only equities and found that put writing can support regular payouts and, in cases of down or flat markets, may allow for higher dollar payouts. The characteristics of the put writing strategy, which typically include lower volatility and shallower drawdowns than long-only equities, allow capital to compound at a higher rate for investors with long time horizons.
Why does put selling make sense now?
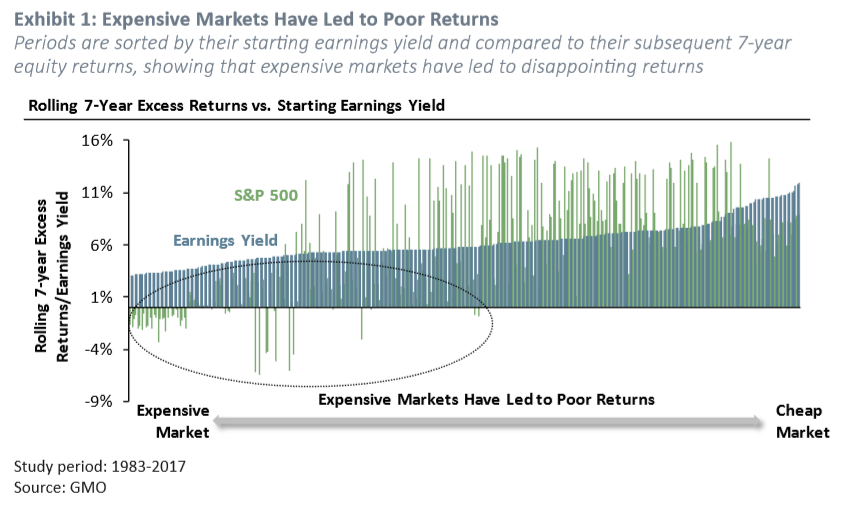
Prior papers have outlined the attractiveness of put writing strategies in an environment of stretched equity valuations, such as the one we find ourselves in today. In summary, the long-term total returns of the equity market result from total earnings growth and the compounding effect provided by reinvested dividends. Over any finite time horizon the realized returns for any given investor are strongly determined by the valuation multiples at which the equities were purchased. When earnings yields are high (i.e. valuations are cheap) subsequent returns have been good to very good, as illustrated in Exhibit 1. In contrast, and more problematically, when earnings-yields are low (i.e. valuations are rich) the subsequent returns have been quite poor.
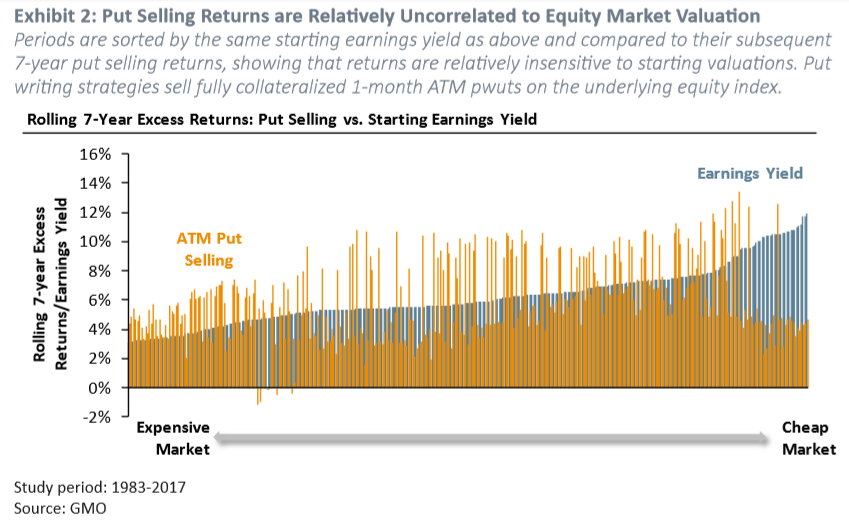
The question is then: how can an investor generate long-term returns commensurate with those of the equity market but without as much exposure to the vicissitudes of valuations? Put sellers have, by definition, no exposure to the upside of the equity market. Instead, they collect an option premium as compensation for insuring against downside equity risk. Option premium, in turn, is driven by the so-called implied-to-realized gap, which is a measure of the difference between the price at which an option is sold and an ex-post reckoning of what the fair price should have been. While the implied-to-realized gap has generally been positive for equity indices, it does vary over time. Importantly, its variation has been especially uncorrelated with equity market valuations. It is this feature which gives put writing returns a low correlation to equity valuations, as seen in Exhibit 2.
Put writing returns produce more consistent total distributions than long-only equities
Although we have written on the advantages to put selling as outlined above, it is less well understood how this smoother and differentiated return stream enhances distributions for institutional investors. By distributions, we mean the quarterly or annual financial disbursements that institutions draw on to support their broader mission. For a university, this is the percentage of the endowment that is tapped to support operating activities, for example. To illustrate the enhanced distributions of put writing, we provide a simple comparative backtest of both long-only equities and put writing with their respective total distributions. From this straightforward exercise, it is clear that the return profile of put selling strategies—which exhibits less volatility and shallower drawdowns—enhances distributions more than the total returns suggest. Furthermore, this is true whether the institution has a policy of annual or quarterly distributions.
To model this, we assume that institutions withdraw 5% annually from their capital pools. As an additional robustness test, we also model distributions that occur at a quarterly frequency. Thus for a 5% distribution rate, the institution draws 1.25% of the strategy proceeds every quarter, on the last business day of the quarter.
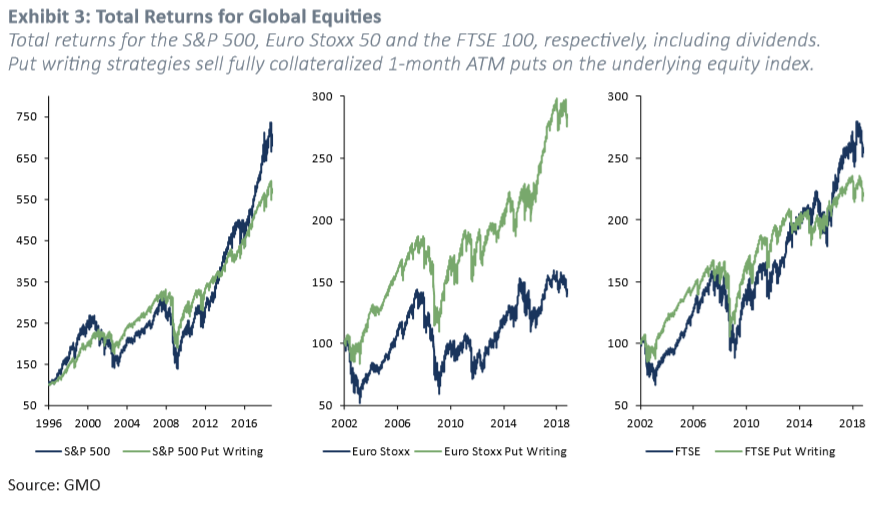
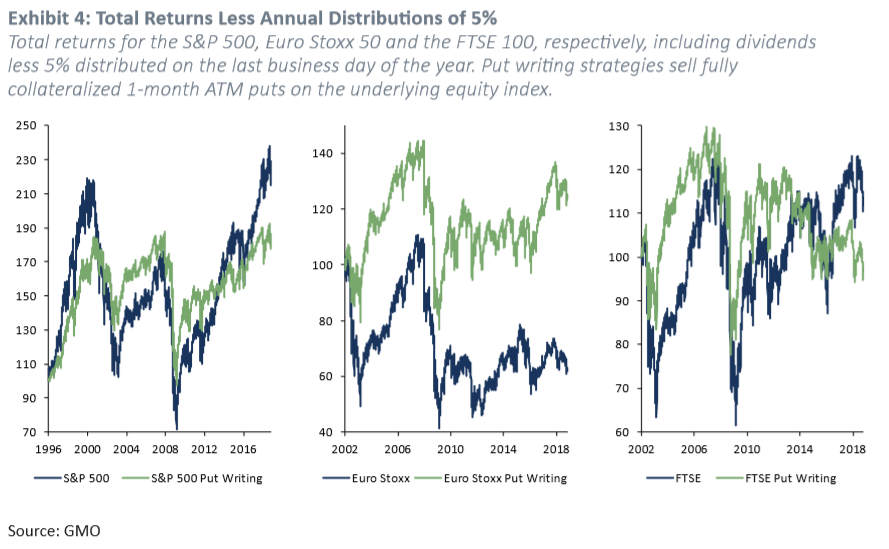
Below, in Exhibit 3, we start with the total returns of several blue chip indexes. How do the total returns look once we allow investors in the strategies to withdraw 5% per annum on the last business day of the year? You’ll find the returns after distributions in Exhibit 4. Notice that after distributions the total return profiles of equities and put selling flatten, which should be intuitive. Of course, the degree of flattening depends on how much capital an institution withdraws on an annual basis.
How will the returns impact distributions? This is not as straightforward, as much depends on when the distributions are tapped, and the impact of compounding on the residual assets of each respective strategy. Hence merely observing Exhibit 4 paints a misleading picture of the distributions of an institution.
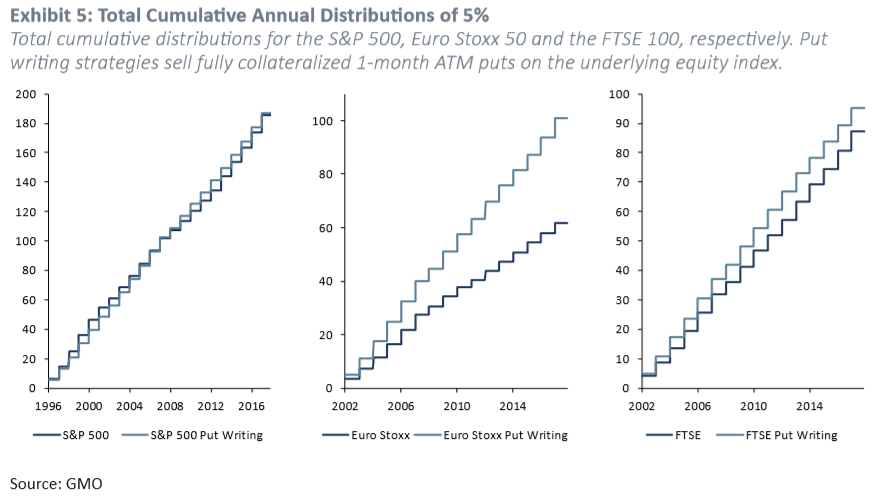
In Exhibit 5, we plot the quantity of study directly: below you’ll find the total distributions of longonly equities (in blue) versus that of put-writing (in green). Notice that because of the steady nature of returns of put writing (lower volatility with more shallow drawdowns) the total distributions are actually higher for put writing versus that of equities. In the U.S., the distributions are almost identical, with the total distributions of put writing just 80 basis points higher versus that of equities.
In the case of the Euro Stoxx, put writing actually produces total distributions that are an impressive 64% higher versus equities (second panel of Exhibit 5). We don’t want to over interpret this result. Importantly, observe that this specific outcome is tied to the particular sample window, which began in 2002 a period in which broad European equities declined by nearly 50%, a much steeper drawdown than that of U.S. broad equities over the same period, although roughly on par with the U.S. technology sector. Here, the conclusion is path dependent and the starting point matters. In this light, the low total distributions afforded to Euro Stoxx equity investors compared to put sellers can be interpreted as a type of lower bound—a cautionary tale of the perils to long-term capital allocation from steep drawdowns. Finally, for FTSE, put writing distributions are 9% higher. Therefore, in all three of the blue chip equity indexes, put writing allowed for greater distributions than the equivalent equity strategy, even though the actual outcome is highly dependent on the particular path of underlying index returns.
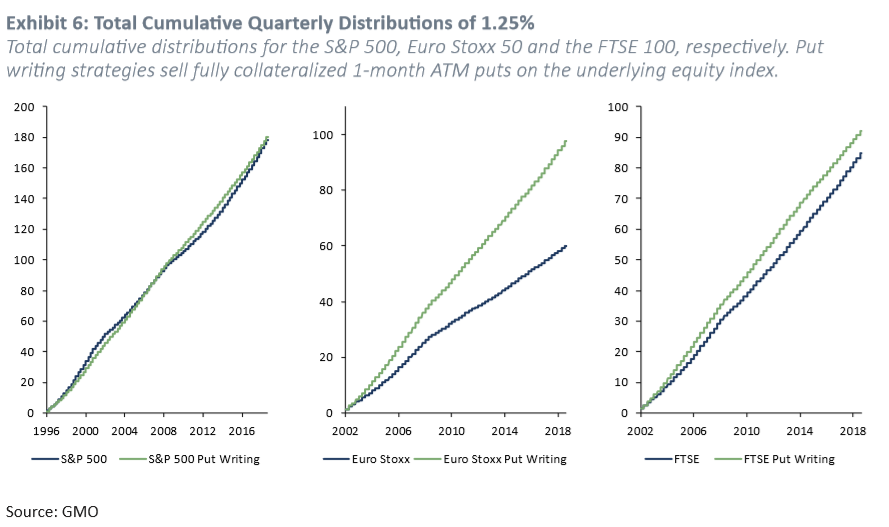
Next, we test quarterly disbursements of capital. We find the results to be similar. You can see the results in Exhibit 6. Hence, whether an institution withdraws quarterly or annually should not materially change the conclusion, as far as history is concerned. The quarterly disbursements chart in Exhibit 6 make clear that total distributions of put selling exhibit lower variability than that of a corresponding basket of equities. Notice that the slope of the total distribution lines of put selling are not only higher but also, and perhaps more importantly, steadier than that of long-only equities, a fact that should not be lost on investors with spending policies that entail consistent pro rata disbursements.
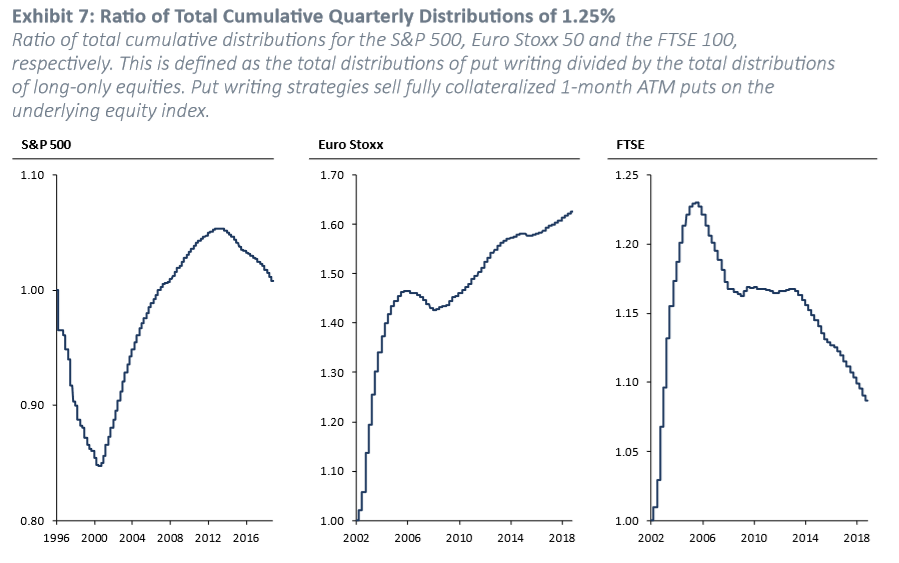
Finally, we want to get a better sense of exactly when it is advantageous to allocate to put selling over long-only equities, at least as far as total distributions go. To accomplish this, we plot the ratio of the total distributions of put selling divided by the total distributions of long-only equities, at a rate of 5% per year and disbursed quarterly, which you can see in Exhibit 7. Notice that from these charts, it becomes clear that put selling distributions gain significant ground over most stages in the market cycle, especially during drawdowns and recoveries. This relative distribution outperformance persisted, even for many years, as the charts make clear. However, as a few episodes illustrate—the U.S. market from the 1997 to 2001, European and UK equities from 2005 to 2007, and U.S. and UK equities more recently—long-only equities make up some ground in the late stages of the equity cycle, especially during strong bull markets.
Conclusion
Over multiple market cycles, put selling allowed for greater distribution and no meaningful capital erosion compared to long-only equities. Broadly, this allowed for a smoother profile of distributions. The lower volatility and shallower drawdowns of put selling strategies have translated almost directly to dependable distributions, which were steadier and exhibited lower variance, especially in the crosssection. It stands to reason that distributions from put selling have done no worse than long-only equities and in some cases, especially in Europe, have performed materially better. In the event that the path of an equity index is similar to that of the Euro Stoxx over the past 15 years, then distributions will likely be higher. We don’t claim that this result is always guaranteed, but seems to hold outside of extreme and prolonged bull markets.
About the Authors
Van Trieu Le. Mr. Le is a research analyst for GMO’s Global Equity team. Previously at GMO, he was a member of GMO’s Asset Allocation team. Prior to joining GMO in 2015, he worked at JP Morgan most recently as a Sales and Trading Associate for Global Asset Allocation Investments and prior to that as a FICC Options Sales and Trading Associate. Mr. Le earned his MS and undergraduate degree in Econometrics and Mathematical Economics from the London School of Economics and Political Science, his Master’s in Mathematics from Cambridge University, and his Master of Finance from Princeton University.
Michelle Morphew. Ms. Morphew is a portfolio strategist for GMO’s Global Equity team. Prior to joining GMO in 2017, Ms. Morphew worked at Arrowstreet Capital, LP, most recently as a portfolio manager. Previously, she was a product specialist at Wellington Management Company and prior to that was an equity analyst at Putnam Investments. Ms. Morphew received her A.B. in Social Studies from Harvard University, her M.A. in International Studies from The Lauder Institute at the University of Pennsylvania, and her MBA in International Financial Analysis from the Wharton School at the University of Pennsylvania. She is a CFA charterholder.
HedgeThink.com is the fund industry’s leading news, research and analysis source for individual and institutional accredited investors and professionals


