


Hedge Funds Net-Short Gold First Time in History
Last month, hedge funds and other speculators shifted to a net-short position (bearish) in Gold for the first time in the history, as per the record maintained by the U.S. government since 2006.
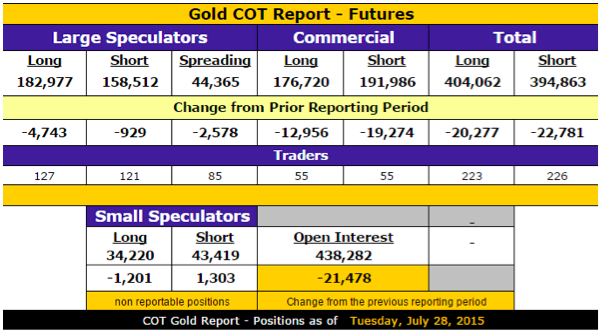
Though Gold price started its downward journey in November 2011 from its peak of $1900 sliding to $1100 an ounce, the speculators were net long till mid- July 2015. It was only that the CFTC Commitments of Traders Data reported that for the first time the fund managers have a net-short bearish position on 21 July. The COT report is published weekly by the Commodity Futures Trading Commission (CFTC) that contains an up-to-date information on futures market operations. As on July 21, 2015, the funds and other speculators held net-short position of 11,345 contracts in Gold futures and options as. Money managers continued to stay net-short on gold for a second week on July 28, almost at the same level with 11,334 net-short position in futures and option contracts with more than $1 billion notional value. Long holdings continue to drop for a fifth week and short holdings of small speculators are increasing. Bearish wagers are climbing.
Hedge funds are now holding the first ever bet on a decline in gold prices. Let us have some insights behind the change in their outlook on Gold.
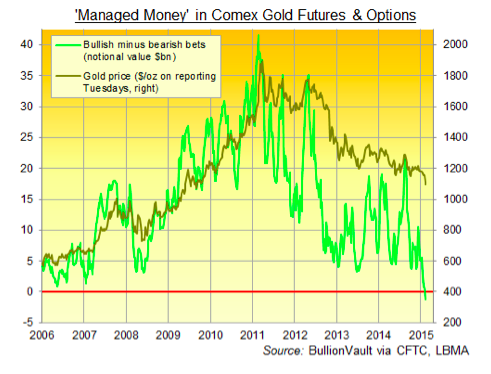
Source: GoldSeek
Net positive bets (bullish minus bearish) on Gold has been on decline since 2011 from a high of above $40 and is now in negative territory. Hedge funds, who trade on Comex gold futures and options, now hold more bearish than bullish contracts, showing a ‘net bearish position’.
Gold at a 5-1/2-year low
Last month, Gold touched $1,077, the lowest since February 2010. Gold had been on a bull run for 11 years at a stretch; the price had soared to $1,900 an ounce in 2011 from $250 in 2001. And then its price started falling and Gold sank into a bear market in April 2013 and is now trading below $1,100. Gold’s tumble is far from over. And according to some analysts, the worst is yet to come.
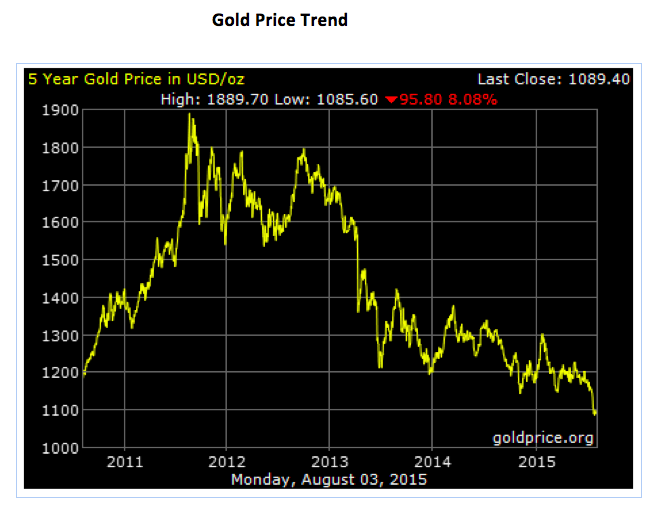
Source: GOLDPRICE
In last one year, the SPDR Gold Trust ETF (GLD), which tracks gold, has declined gradually from $126 to $104 and is just catching up to the trend of the 200-day moving average. GLD also has fallen more than 8 percent year to date tracking gold downfall. Technical Analysts forecast GLD, which is currently trading around $104, could drop as low as $99.
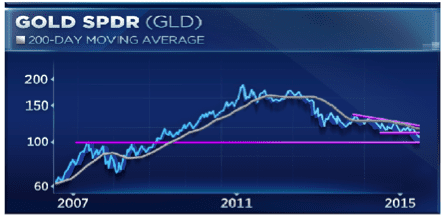
Source: CNBC
Speculation on U.S. Interest rate rise puts pressure on Gold
Prices are plunging amid mounting speculation that U.S. interest rates will climb this year. As Gold doesn’t pay dividends or interest like competing assets, any rate hike would further reduce the glittering of gold. Gold which is not attached to dividends or interest rates, will have to struggles to compete with high-yield bearing assets in raising rate environments. So as the Federal Reserve gets closer to a rate hike, gold will feel more pressure.
The strength of the US dollar
The dollar has gained 8 percent year to date. Gold is quoted in dollars and any upward move in the greenback tends to put downward pressure on gold prices. Gold becomes more expensive in local currency for foreign investors and it reduces their buying power.
Physical demand for gold declines
China and India are the world’s top gold buyers; they account for more than 40% of the global demand. But China is passing through the slowdown phase and its PMI is declining. Chinese demand for gold also recorded a 26 percent drop. On-going crisis in the China’s stock markets has further shaken. India’s gold appetite also remains sluggish.
Gold slump is a part of a broader slump in commodities such as oil and copper. The Bloomberg Commodity Index touched a 13-year low. Considering all these factors, the hedge managers have turned bearish on Gold. It looks like gold is going to continue to go down.
Kanchan Kumar is an experienced finance professional and has worked as an Executive Director and Advisor with the MNCs. He is a former banker with two decades of working experience with a Financial Institution. He is a rank holder in MBA (Finance) and Gold Medallist in MS (Statistics). He has passion for research and has also taught at a University. He writes on Global Economy, Finance and Market.


 Appoints Three New Members To The Board")


