
eFront, a financial software and solutions provider dedicated to Alternative Investments, has published its latest Quarterly Private Equity Performance report, showing that private equity funds globally have maintained a high level of performance, despite falling from the record level seen in 2017. Sharply reduced selection risk and shorter time-to-liquidity signal strong activity and a solid exit and refinancing environment.
Key findings:
- LBO fund performance dipped from the record levels seen in 2017
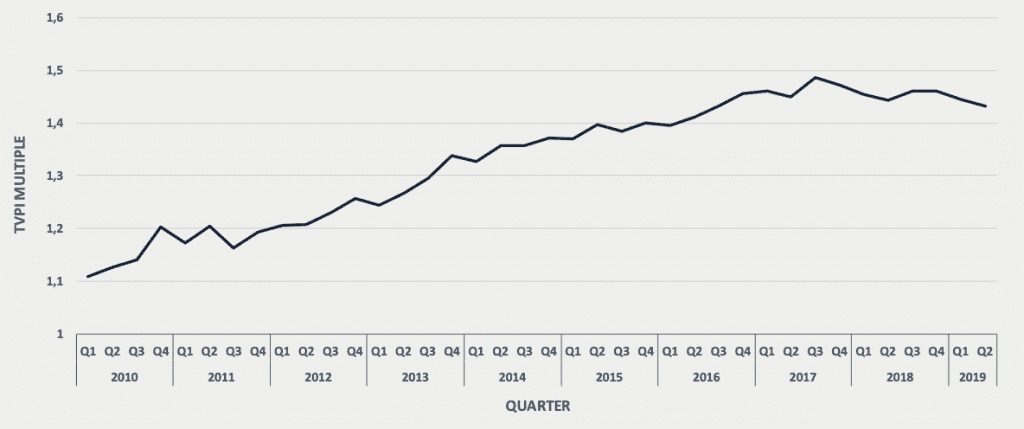
- Returns reached 1.437x in Q2 2019 – a net excess performance of 0.101x when compared to the ten-year average of 1.336x
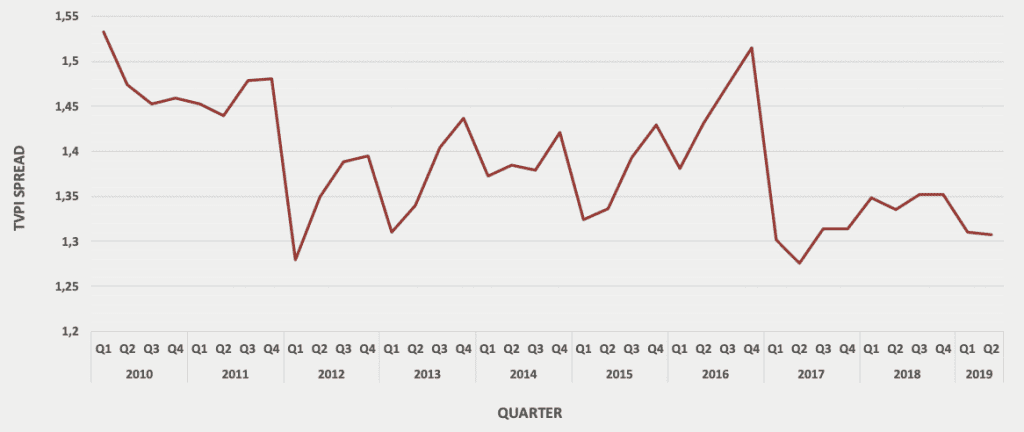
- Investment risk fell between Q4 2018 and Q1 2019 – at 1.308x, the current level is close to the lowest points seen over the past 10 years
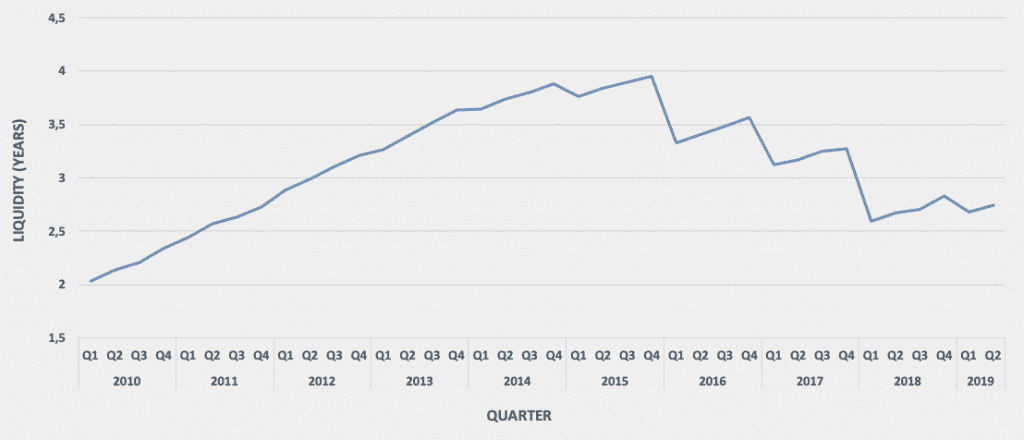
- For time-to-liquidity, the downward trend initiated in 2015 reached a bottom in 2018, and since then has stabilized at around 2.7 years
- For the US, active LBO funds are performing well when compared with the historical average, but the correction in valuations has moved more recent vintages down towards the average
- Active Western European funds divide into two groups, with vintage years 2010-12 on track for outperformance, while funds of 2013-16 have less certain performance
So far in 2019, private equity funds globally have maintained a high level of performance, despite continuing a retreat from the peak achieved in 2017. This is a moderate convergence towards a multiple of 1.4x. In retrospect, 2017 was an historic year, and the decline since has been only modest, with 2018 the second best and 2019 positioned to become the third best performing years this decade. However, the second half of the year might change this perspective, and 2019 could ultimately see a stabilization or even an increase in performance.
Since 2013, returns have followed a pattern of either stabilizing or decreasing slightly over the first half of the calendar year. Nevertheless, the performance of active LBO funds remains very slightly above the five-year average of a 1.434x money multiple. Excess performance reaches 0.101x when compared to the ten-year average of 1.336x.
If the performance of active LBO funds has decreased, so has the risk. Selection risk (between the top and bottom 5% funds) fell between Q4 2018 to Q1 2019, and has since stabilized. At 1.308x, the current level is close to the lowest points of Q2 2017 and Q1 2012.
A slightly lower level of performance and a sharp decrease of selection risk hint at a wave of investments in the first half of 2019. These additions to the fund portfolios are booked at purchase price minus costs and reduce the dispersion of performance between fund managers.
A longer perspective shows that the dispersion of performance of fund managers has been declining since 2010 on average. This is not a straight decline as the spike of 2016 shows. Nevertheless, after a period of stabilization in 2018, dispersion risk is on the decrease, nearly matching the historically low level of 2017.
Looking at time-to-liquidity, since 2015 a pattern has emerged, with a drop recorded during the first quarter of each year and an increase over the three following quarters (Figure 3). 2019 seems to match this pattern, even though the first quarter decrease is not as sharp as witnessed in the three previous years. The general downward trend initiated in 2015 seems to have reached a bottom in 2018, and since then the time-to-liquidity has stabilized at around 2.7 years.
Market conditions seem to be supportive of a higher rotation of companies in portfolios. Interest rates remain low and industrial buyers can acquire portfolio companies thanks to abundant and fairly cheap liquidity. Moreover, the current market environment is supportive of dividend recapitalizations, which reduce significantly the time-to-liquidity. Dividend recapitalizations might explain the stabilization of time-to-liquidity just above the threshold of 2.5 years needed by fund managers to apply their skills and create value in portfolio companies.
The long-term average of time-to-liquidity is now down to 3.12 years and 2019 seems on the verge of equaling or even exceeding the decrease of time-to-liquidity when compared with this long-term average. This in turn fuels more frequent and larger fund raising, as the capital distributed to fund investors can then be recycled in the next generation of funds.
Tarek Chouman, CEO of eFront, commented:“Q1 2019 provided a welcome improvement of the multiples of active funds, after a challenging Q4 2018. Q2 2019 moderated this improvement. Whether this is a pause, or the start of a deeper trend remains to be seen. Overall, active LBO funds have maintained a high level of performance. Selection risk has decreased significantly, as well as time-to-liquidity, both hinting at a wave of new investments during that period. Recurring low interest rates and high levels of liquidity are also supportive of exits and dividend recapitalizations.”
“Should this marginally lower performance and sharply reduced risk seen since Q1 2017 be described as a ‘new normal’? It is too early to say, but there is a visible downward trend in terms of selection risk. The increasing maturity of the asset class and relatively benign macro-economic conditions can explain this risk-reduction phenomenon,” Tarek Chouman concluded.
Read More:
Renaissance Technologies fund performance
aqr capital management hedge fund

Peyman Khosravani is a global blockchain and digital transformation expert with a passion for marketing, futuristic ideas, analytics insights, startup businesses, and effective communications. He has extensive experience in blockchain and DeFi projects and is committed to using technology to bring justice and fairness to society and promote freedom. Peyman has worked with international organizations to improve digital transformation strategies and data-gathering strategies that help identify customer touchpoints and sources of data that tell the story of what is happening. With his expertise in blockchain, digital transformation, marketing, analytics insights, startup businesses, and effective communications, Peyman is dedicated to helping businesses succeed in the digital age. He believes that technology can be used as a tool for positive change in the world.