
Hedge funds and other large speculators who had accumulated oil futures and options contracts to the highest level since 2011 are sharply cutting their bullish positions. In April third week, their net long positions in WTI crude futures and options were 276,051 contracts and Brent futures and options numbered 271,929 contracts.
Data from the Intercontinental Exchange (ICE) show the hedge funds’ net long futures and options position in Brent – the difference between bets on rising and falling prices – had fallen by one-third in less than two months to 191,804 contracts at June end.
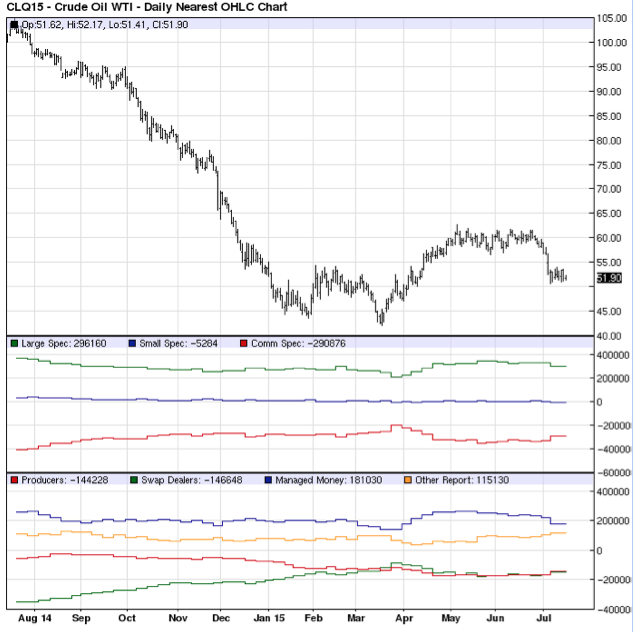
The Commitment of Traders (COT) weekly data of the Commodity Futures Trading Commission (CFTC) also show that futures market traders and large oil speculators sharply decreased their overall bullish bets in WTI oil futures by 10% within a week to a net position of +296,160 non-commercial contracts on 7 July. Similarly, producers and oil traders decreased their existing positions by 12% to a net total position of -290,876 contracts.
Source: barchart
A closer look of the logic behind such moves reveals that the Hedge Funds’ action has been influenced by factors like shale oil boom, unpredictability of OPEC decision and uncertainties in global economy. Let us see these developments in more detail.
Oil price roller coaster
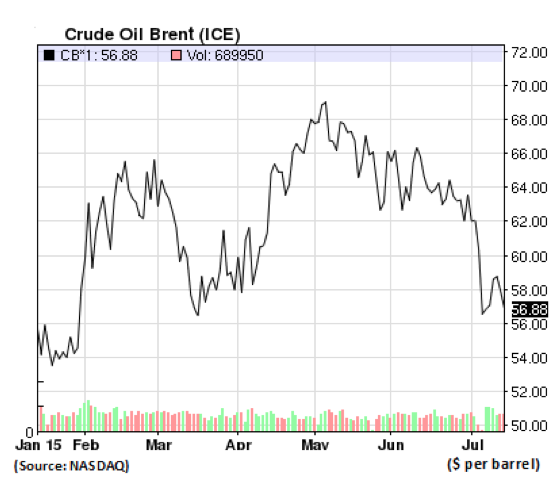
The price of crude oil seems erratic. It swings up, then down, in endless and apparently incomprehensible way. The markets witnessed sharp decline in oil price to six years low and then surge by a half, all within a few months. Brent crude had fallen by 60 percent from $115 in June 2014 to near $45 a barrel in January 2015, the lowest level in six years. Market never anticipated such a steep fall within six months. Thereafter oil started to recover and Brent hit near $70, its high for the year in early May before running out of steam. Brent has remained volatile between $50 and $70 since January. This roller-coaster has left even market pundits confused.
And such wide fluctuations have been seen in the past too. In 1973, OPEC imposed an embargo and the price of oil shot up from $1.70 a barrel to $12.50. In 2008 also, the members agreed to cut the production ceiling by 2.2 million barrels per day when the price had crashed to $37 from $137 due to global economic crisis. These are examples of dramatic behaviour of oil price that makes difficult to find a familiar pattern.
OPEC firmness on decision not to cut production put pressure on oil price
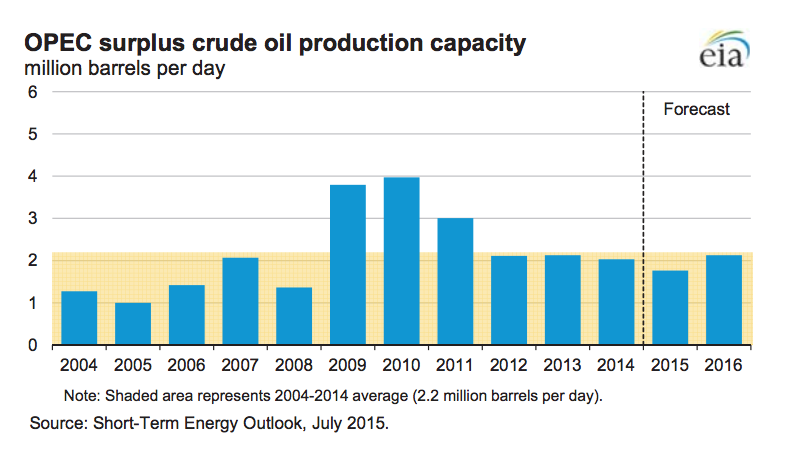
The Organization of the Petroleum Exporting Countries’ decision in November 2014 to maintain output was the trigger point that accelerated oil price decline. OPEC, an oil cartel of 12-nation group, holds the majority of oil reserves, accounting for 81% of the global total and pumps more than a third of world output. As OPEC controls much of the world’s oil supply, the cartel used dictate the price trough production cuts and regulating supplies.
But this time Saudis, which controls a third of total group’s output, blocked OPEC output cut.
Again in June 2015, OPEC reiterated its earlier stand to maintain the official production ceiling of 30 million barrels a day, saying that the global economic recovery and growing oil demand justified maintaining high production levels. In fact, OPEC is pumping 31.33 million barrels a day, 1 million barrels a day above the OPEC’s official supply target.
 Source: Short-Term Energy Outlook, July 2015, by EIA
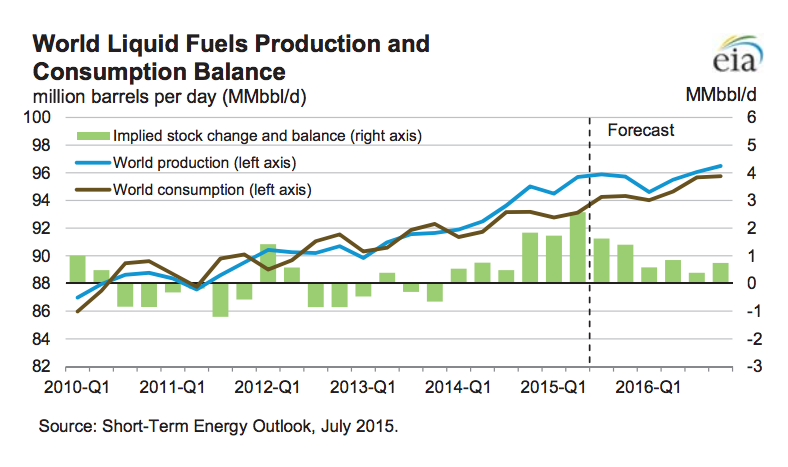
Shale oil boom brought supply glut
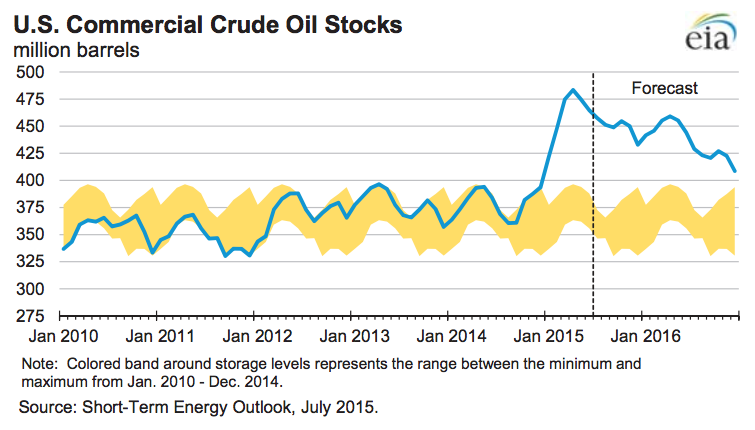
Thanks to shale boom, the United States is now oil producer # 1 in the world. The U.S. reached 9.7 million barrels per day in April 2015, crossing also the historical high of 9.6 million barrels per day achieved in 1970. The U.S. crude oil inventories touched a peak of 491 million barrels, the highest in 80 years.
Source: Short-Term Energy Outlook, July 2015, by EIA
OPEC’s low price strategy was to make costly high-tech based shale projects uneconomical; this worked but partially. As the U.S. Energy Information Administration (EIA) says that though the U. S. oil production will decline but the declines won’t be huge, production will average 9.5 million barrels per day in 2015 and 9.3 million barrels per day in 2016, not very low compared to present level of 9.6 million barrels per day.
Iranian oil to hit an already oversupplied market
Iran nuclear deal with the P5+1, just agreed, would lift sanctions and pave the way for Iranian oil hitting the market any time soon. Saudi and Iraqi output is already rising. The U.S. is producing above its earlier peak and Russia is producing above a post-Soviet record. Thus, more and more, oil is being pumped into the market from all corners putting further pressure on price.
Source: Short-Term Energy Outlook, July 2015, by EIA
Slow global economy growth pulls down oil demand growth
Economic growth outside of the US has been slow. The World Bank projects the global economy would expand only 2.8 per cent this year. Oil demand falters with slowdown of Chinese economic growth and China’s stock market plunge. Continuing recession in Europe and Greece’s debt woes escalate the problem. Global oil demand growth is forecast to slow to 1.2 million barrels per day in 2016, from an average 1.4 million barrels per day this year. “Oil demand growth is not matching with increase in supply putting pressure on price,” says the International Energy Agency (IEA).
“The bottom of the market may still be ahead,” concludes the IEA. And speculators are decreasing their overall bullish bets in oil futures to reduce their further loss.
Read More:

Peyman Khosravani is a global blockchain and digital transformation expert with a passion for marketing, futuristic ideas, analytics insights, startup businesses, and effective communications. He has extensive experience in blockchain and DeFi projects and is committed to using technology to bring justice and fairness to society and promote freedom. Peyman has worked with international organizations to improve digital transformation strategies and data-gathering strategies that help identify customer touchpoints and sources of data that tell the story of what is happening. With his expertise in blockchain, digital transformation, marketing, analytics insights, startup businesses, and effective communications, Peyman is dedicated to helping businesses succeed in the digital age. He believes that technology can be used as a tool for positive change in the world.