
The relationship between the growth in assets under management (AUM) and percentage returns is one of the hot topics in the hedge fund industry at the current time. Essentially, the more capital a hedge fund has under management, the more difficult it is to produce blockbusting returns. For example, a hedge fund with a relatively small amount of capital can afford to place quite a large proportion of its assets on the line in order to make a big profit without drawing too much attention to the deals it is making – attention that would suck the value out of said deals.
Conversely, one with huge amounts of capital could make the same types and sizes of deals, but the proportion of their overall portfolio that these deals would represent means that even if they generated huge returns, the effect on their overall returns would be diluted. They could, of course, try to invest a larger sum in these deals in keeping with their size, but there are several reasons why they might encounter problems in doing this. For starters, there is the aforementioned problem that oversized deals would influence the asset prices in such a way that the deals may no longer be so profitable.
And even if this problem could be worked around by staggering the deals through automated trading technologies, which is something that traders have been able to do since the 1970s within limits, there would still be the issue of oversight. For the most part, the growth in AUM has come from the influx of institutional money into the alternative investment market, but with this has come greater demands for transparency. In an industry that thrives on secrecy as much as the alternative investment market does, this can be a severe restriction in terms of the types of deals they can pull off.
This has caused a situation where hedge funds with large amounts of capital under management are performing far less well, for the most part, than smaller, more agile firms. However, there is plenty of anecdotal evidence about that suggests that smaller managers with strong percentage returns are attracting new capital quickly, which has the tendency to dilute their future returns. Also, the concentration of capital among large hedge funds has led to suggestions that this may be one of the main factors behind the decline in industry-wide alpha.
A recent report carried out by BeachHead, which looked at nearly 3,000 equity long/short funds in an effort to find out more about this issue, came up with some interesting findings. This study divided the hedge fund universe into two categories: small (equity long/short firms with $50m-$500m in AUM) and big firms with more capital than this.
On the whole, the study showed that smaller hedge fund managers tend to outperform larger ones, which chimes with the prevalent thinking that smaller is usually better when it comes to hedge funds. Over a five year period, small firms outperformed big firms by 254 bps per annum, while over a ten year period the figure was 220 bps.
This trend of outperformance by smaller funds was most pronounced in the years immediately before and after the financial crisis, especially so in 2009. Virtually all of the outperformance was due to alpha rather than beta, and the dispersion of returns among smaller funds was greater than those of larger firms.
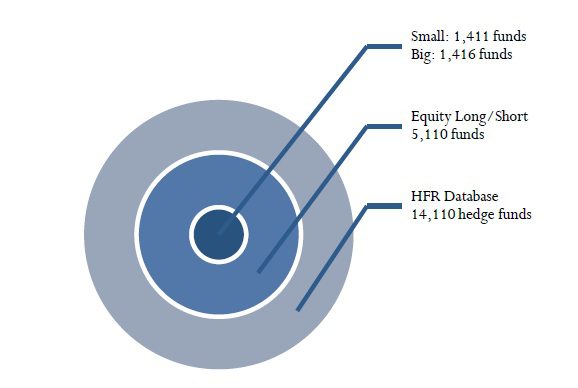
The number of small and big firms in the sample was roughly equal. The average amount in assets under management for small firms in 2012 was $193 million, while for big firms it was $3.7 billion. Over the past decade, the average assets of big firms have tripledwhile small firm assets have remained roughly constant, showing that big firms have had it easier in terms of attracting capital.
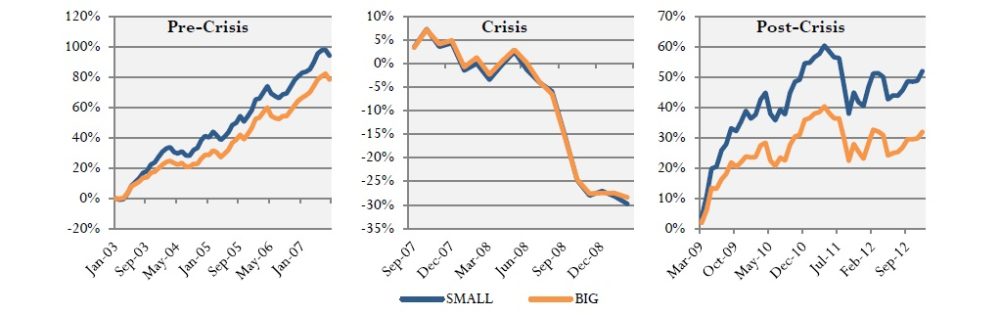
Performance-wise, though, over the last decade small firms have had it much easier, with small equity long/short managers returning 7.56% per annum, outperforming their larger peers by 220 bps per annum. This trend has been even more pronounced recently, with the average outperformance over the past five years being 254 bps per annum. The chart below shows the returns of small and big managers over the past ten years.

As you can see in the charts below, the trend of outperformance by small managers was much more pronounced before and after the crisis, especially during the post-crisis recovery. A surprising aspect of this is that despite somewhat higher beta, smaller firms did not underperform larger ones during the crisis, perhaps a reflection of better risk management or greater agility due to a smaller capital base.
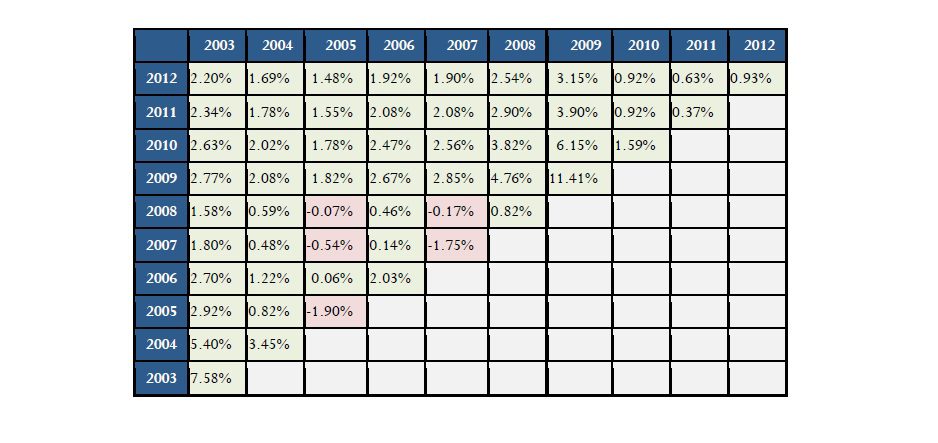
The following chart demonstrate just how consistent this outperformance was. The date on the top row reflects the inception of an investment that terminates in the year on the vertical column; the percentage in the corresponding cell reflects the compound annual return differential of Small less Big over the specified period. For example, the cell on the upper left shows 2.20% of compound annual outperformance of small vs. big between 2003 and 2012. The green highlighted boxes show periods of outperformance by small funds, while the red boxes highlight the occasions when the reverse has been true.
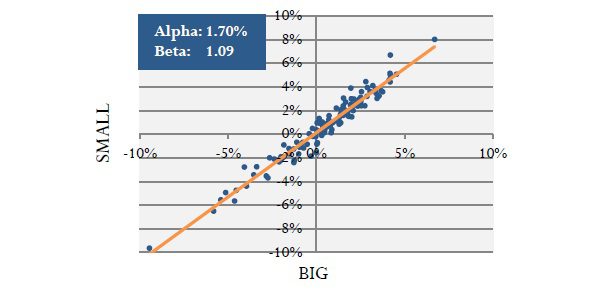
Its interesting to note that outperformance doesn’t seem to be something that can be attributed to rapid or regular changes in market exposure. In fact, the beta of small to big seems to be consistent around the 1.1. mark, with stable correlations above 0.95. As a result, comparable drawdowns during the crisis would seem to reflect bigger market-driven losses that have been offset by persistent positive alpha.
The next chart looks at the alpha of the small portfolio relative to the big portfolio over a decade, with alpha annualized in the box. For the most part, the outperformance is due to alpha rather than beta, confirming the fact that the differential cannot be explained in terms of greater risk taking.
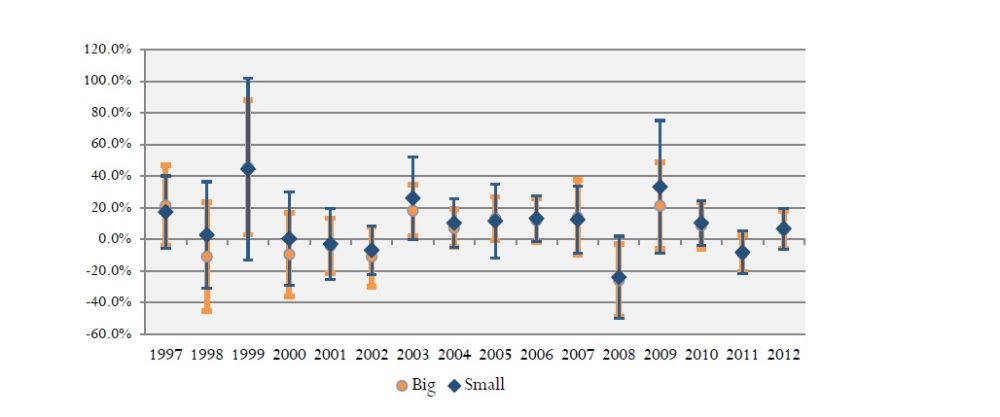
Another aspect of the study was the dispersion of returns, which served to test the idea that smaller managers are motivated to outperform, while larger firms are more risk averse. The following chart shows the annual returns of the funds in the small and big portfolios with the mean, minimum and maximum fund returns. Since the late 90s, the best performing small funds have done much better than the equivalent big funds. As an interesting aside, even the worst performing Small funds matched or outperformed the comparable big funds most years, and this gives weight to the argument that small fund outperformance is not driven by higher symmetric risk taking.
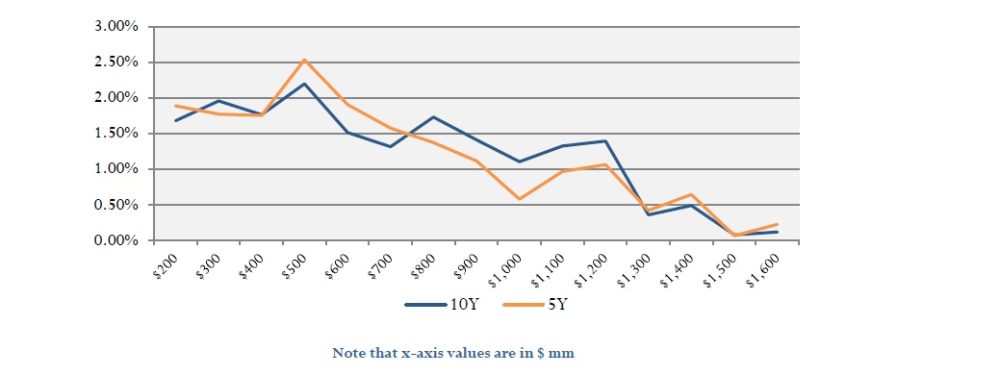
The final analysis in the study showed what would happen if the threshold between Small and Big managers was lowered or raised. The following chart shows the differential in returns over the past five and ten years, demonstating clearly that the outperformance of smaller managers declines as AUMs increase. For example, when small is defined as less than $1.0 billion, the outperformance relative to larger managers is 1.1% over ten years and 0.6% over five years.
For most investors, the key issue is the factors that are driving the differential in returns. One may be that the most talented managers tend to self-select to start firms rather than working at larger firms. In most cases, the best managers will build their careers at big firms before starting their own. Another may be that smaller managers have a better opportunity set. In terms of trading volume, the number of potential long and short side investments declines by up to 80 percent between $100 million and $1 billion in assets under management. The third reason is that traders at smaller firms are incentivised to outperform in a way that traders at larger firms are not, and this is backed up by the figures, which suggest that 80% of the enterprise value of larger firms is due to capitalized management fee EBITDA rather than performance fees.

Peyman Khosravani is a global blockchain and digital transformation expert with a passion for marketing, futuristic ideas, analytics insights, startup businesses, and effective communications. He has extensive experience in blockchain and DeFi projects and is committed to using technology to bring justice and fairness to society and promote freedom. Peyman has worked with international organizations to improve digital transformation strategies and data-gathering strategies that help identify customer touchpoints and sources of data that tell the story of what is happening. With his expertise in blockchain, digital transformation, marketing, analytics insights, startup businesses, and effective communications, Peyman is dedicated to helping businesses succeed in the digital age. He believes that technology can be used as a tool for positive change in the world.