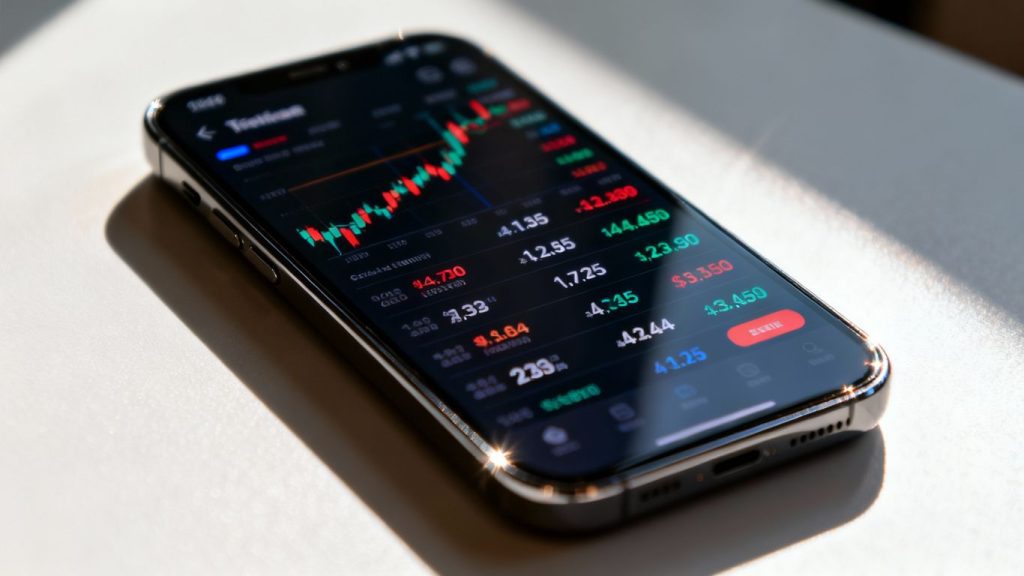
Keeping tabs on your investments doesn’t have to be complicated. Google Finance offers a straightforward way to build a watchlist, letting you see how your stocks are doing without a lot of fuss. It’s a free tool that gives you a quick look at prices and related news. But what if you want to dig a little deeper or track things more closely? We’ll explore how to get the most out of your google finance watchlist today and even look at ways to make it work harder for you.
Key Takeaways
- Setting up a google finance watchlist today is simple: just go to Google Finance, sign in, and start adding stock symbols.
- You can customize your watchlist by choosing which data columns, like market cap or P/E ratio, are most important for you to see.
- Google Finance provides real-time price updates, but it has limitations on historical data and automated alerts.
- For more advanced tracking, you can use the GOOGLEFINANCE function in Google Sheets to pull stock data into your own custom dashboards.
- Add-ons like Wisesheets can significantly expand your google finance watchlist today, offering deeper financial metrics and automated portfolio tracking capabilities.
Getting Started With Your Google Finance Watchlist Today
Setting up a Google Finance Watchlist is a straightforward process, designed to give you a quick overview of the stocks you’re interested in. It’s a free tool, so there’s no barrier to entry if you have a Google account.
Accessing Google Finance
First things first, you need to get to the Google Finance website. It’s easy to find; just type “Google Finance” into your search engine or go directly to finance.google.com. Once you’re there, you’ll need to be logged into your Google account. This is how Google keeps your watchlists and any portfolio information tied to you.
Related Content: google finance watchlist
Creating Your First Watchlist
Once you’re logged in and on the Google Finance page, look for the “Watchlist” section. It’s usually on the right side of the page. You’ll see an option to create a “New watchlist.” Give it a name that makes sense to you – maybe “Tech Stocks” or “Dividend Plays.” After naming it, just click “Save.” It’s that simple to get a blank slate ready for your investments.
Adding Investments to Your Watchlist
Now for the main event: adding stocks. On your newly created watchlist, you’ll find a button like “+ Investment” or “Add investments.” Click on that. A search bar will appear. Start typing the name or the ticker symbol of the company you want to follow. For example, if you’re interested in Apple, you’d type “Apple” or “AAPL.” Once you select the correct stock from the results, it will be added to your list. You can repeat this process for as many stocks as you like, building out a personalized view of the market.
It’s important to remember that a watchlist is primarily for tracking. It shows you current prices and basic changes, but it doesn’t track your actual investment performance like a portfolio would. Think of it as a curated news feed for the stocks you care about.
Here’s a quick rundown of the steps:
- Go to finance.google.com and log in.
- Find and click on “Watchlist.”
- Click “New watchlist” and give it a name.
- Use the “+ Investment” button to search for and add stock ticker symbols.
- Repeat for all the stocks you want to monitor.
Customizing Your Google Finance Watchlist Today
Once you’ve got your basic Google Finance watchlist set up, it’s time to make it work for you. Think of it like organizing your desk – you want the important stuff front and center, right? Google Finance lets you tweak your watchlist so you’re seeing the information that actually matters to your investment tracking.
Selecting Key Data Columns
Your watchlist doesn’t have to be a one-size-fits-all display. You can choose what data points appear next to each stock. This is super helpful because different investors care about different things. Maybe you’re focused on a stock’s immediate price movement, or perhaps you’re more interested in its long-term valuation.
Here are some common columns you might want to add:
- Price: The current trading price of the stock.
- Change: The difference in price from the previous day’s close.
- % Change: The percentage difference in price from the previous day’s close.
- Market Cap: The total value of the company’s outstanding shares.
- P/E Ratio: The price-to-earnings ratio, a common valuation metric.
- 52-Week Range: The highest and lowest prices the stock has traded at over the past year.
To change these, you’ll usually find an option to “Customize columns” or “Edit columns” directly on your watchlist page. Just click it and select the metrics that best suit your tracking needs.
Organizing Your Watchlist View
Beyond just picking columns, you can also change how your watchlist is sorted. Most people start with alphabetical order by ticker symbol, but that’s not always the most useful. You might want to sort your watchlist by:
- Performance: See which stocks are up or down the most today.
- Market Cap: Group larger or smaller companies together.
- Alphabetical: The default, but still an option.
Look for sorting arrows or a “Sort by” option near the column headers. Clicking these will rearrange your list on the fly, making it easier to spot trends or manage your holdings.
Understanding Real-Time Price Updates
This is where the “real-time” part of Google Finance really shines. The prices you see on your watchlist are generally updated very frequently, often within seconds or minutes of actual market trades. This means you’re getting a close-to-the-moment look at how your investments are performing. It’s important to remember that there might be a slight delay depending on your internet connection and the specific stock exchange’s data feed. However, for most day-to-day tracking, it’s more than sufficient to make informed decisions without needing to constantly refresh the page.
While Google Finance provides a good snapshot, it’s worth noting that true, millisecond-level trading data is typically reserved for professional trading platforms. For the average investor, however, the updates provided are more than adequate for monitoring performance and making timely decisions.
By taking a few minutes to customize your watchlist, you transform it from a simple list into a powerful, personalized tool for keeping tabs on the market.
Leveraging Google Finance Watchlist for Stock Tracking
Once you’ve set up your Google Finance Watchlist and populated it with your chosen investments, the real work of tracking begins. This isn’t just about passively observing; it’s about actively using the tool to understand market movements and your portfolio’s health.
Monitoring Stock Performance
The primary function of a watchlist is to keep an eye on how your stocks are doing. Google Finance provides real-time price updates, which means you can see changes as they happen during market hours. This immediate feedback is key for understanding short-term volatility and making quick decisions if needed. You’ll typically see the current price, the day’s change in dollars, and the percentage change. This immediate data helps you gauge the sentiment around a particular stock.
Here’s a look at the kind of performance data you can expect to see:
| Ticker | Current Price | Day’s Change ($) | Day’s Change (%) |
|---|---|---|---|
| AAPL | $175.50 | +2.10 | +1.21% |
| GOOG | $2,800.75 | -15.50 | -0.55% |
| MSFT | $305.20 | +3.80 | +1.26% |
Tracking Multiple Asset Types
Your watchlist isn’t limited to just stocks. Google Finance allows you to track a variety of financial instruments. This means you can get a more holistic view of your investments, all in one place. You can add:
- Stocks
- Exchange-Traded Funds (ETFs)
- Cryptocurrencies
- Major market indices (like the S&P 500 or Nasdaq)
This ability to consolidate different asset classes simplifies the process of monitoring your overall financial exposure and performance across various market segments.
Staying Informed with Financial News
Beyond just price movements, Google Finance integrates relevant financial news directly into your watchlist. When you look at a specific stock or asset, you’ll often see a feed of recent articles and news releases related to that company or sector. This context is incredibly important. A stock’s price might drop, but understanding why – whether it’s due to an earnings report, a new product announcement, or broader economic news – is what truly informs your investment strategy.
Keeping up with financial news alongside price action provides a more complete picture. It helps you differentiate between temporary market noise and significant developments that could impact your long-term investment thesis. Without this context, price changes can seem arbitrary and lead to emotional decision-making.
By combining real-time price tracking with relevant news, your Google Finance Watchlist becomes a more dynamic tool for staying informed about the markets and the specific investments you’re following.
Integrating Google Finance Watchlist with Google Sheets
While Google Finance’s built-in watchlist is handy for quick checks, its real power for serious tracking comes when you connect it with Google Sheets. This integration lets you build custom dashboards and analyze your investments in ways the standard watchlist just can’t match. It’s like taking your basic car radio and upgrading it to a full sound system with navigation.
Utilizing the GOOGLEFINANCE Function
The magic behind this integration is the GOOGLEFINANCE formula. This isn’t just for pulling a single stock price; it’s a versatile tool that can fetch a wide range of financial data directly into your spreadsheet. Think of it as your personal data pipeline from the financial markets to your own custom reports.
Here’s how to get started with the basic price lookup:
- Open a new Google Sheet.
- In any cell, type
=GOOGLEFINANCE(. - Next, enter the ticker symbol of the stock you want to track, enclosed in quotes (e.g.,
"AAPL"). - Close the parenthesis:
). - Press Enter. The cell will then display the current stock price.
The GOOGLEFINANCE function is your gateway to bringing live market data into your spreadsheets.
Importing Basic Stock Data
Beyond just the current price, the GOOGLEFINANCE function can pull a lot more information. You just need to specify what you’re looking for after the ticker symbol. For instance, you can get the stock’s name, its market capitalization, or its 52-week high and low. This allows you to build a more detailed view of your holdings.
Here are a few examples of attributes you can request:
"name": The company’s full name."marketcap": The company’s market capitalization."high52": The 52-week high price."low52": The 52-week low price."pe": The price-to-earnings ratio.
To use these, you’d type something like =GOOGLEFINANCE("GOOG", "marketcap") into a cell. You can then arrange these data points side-by-side in your sheet to create a custom overview of your watched stocks.
While the GOOGLEFINANCE function is powerful, it’s important to note that it doesn’t provide every single data point you might want. For example, dividend information isn’t directly available through this function, which might require you to look elsewhere for a complete picture.
Building Custom Dashboards
By combining the GOOGLEFINANCE function with other Google Sheets features like charts and conditional formatting, you can create sophisticated dashboards. Imagine a sheet that not only shows current stock prices but also calculates the total value of your holdings, tracks daily gains or losses, and highlights stocks that are performing particularly well or poorly. You can even set up formulas to track performance against a benchmark or calculate your portfolio’s overall percentage change. This level of customization is where Google Sheets truly shines for investment tracking, offering a level of detail that a simple watchlist can’t provide. It’s a great way to visualize your financial journey, much like how a hedge fund might track its portfolio performance with specialized software, but accessible to everyone.
Enhancing Your Google Finance Watchlist Today with Advanced Tools
While the built-in Google Finance Watchlist is a solid starting point for tracking stocks, its capabilities can feel a bit limited when you want to dig deeper. Fortunately, there are ways to expand what you can do, especially when you connect it with other tools.
Exploring the Wisesheets Add-on
If you’re looking to really supercharge your watchlist, consider using an add-on like Wisesheets. This tool acts as a bridge, bringing more detailed financial information directly into your Google Sheets. It’s designed to pull in real-time and historical stock data, which can be super handy for more involved analysis. You can also access fundamental financial data, like revenue figures and net income, which aren’t readily available in the standard Google Finance watchlist. Plus, it helps track important events like dividend payouts and earnings reports, which is great for longer-term investors.
Accessing Deeper Financial Metrics
Beyond just stock prices, you might want to see things like a company’s market capitalization, its price-to-earnings (P/E) ratio, or its 52-week trading range. These metrics give you a better picture of a stock’s valuation and performance. Wisesheets, for example, can help you pull this kind of data directly into your spreadsheet. This allows you to compare different companies based on a wider set of financial indicators, not just their current stock price.
Automating Portfolio Tracking
Manually updating your portfolio can be a chore. Add-ons can help automate this process. Imagine having your Google Sheet automatically update with the latest stock prices and current valuations of your holdings. This means less time spent clicking around and more time understanding your investment performance. It’s about making the tracking process smoother and less prone to manual errors, giving you a more accurate view of your investments over time.
The standard Google Finance Watchlist is good for a quick look, but for serious tracking and analysis, you’ll want to look at tools that can bring more data into a format you can really work with, like spreadsheets. This way, you’re not just watching prices, you’re understanding the ‘why’ behind them.
Here’s a quick look at what an add-on might offer:
- Real-time Data: Get up-to-the-minute stock prices.
- Historical Data: Access past performance for analysis.
- Fundamental Data: See key financial figures like revenue and earnings.
- Dividend & Earnings Tracking: Stay informed about company events.
- Automated Updates: Keep your portfolio valuation current without manual input.
Understanding Limitations and Advanced Capabilities
While Google Finance Watchlists are a solid starting point for tracking stocks, they do have their limits. It’s good to know what these are so you can decide if you need more.
Recognizing Native Watchlist Constraints
The built-in Google Finance Watchlist is great for a quick look at prices and basic changes. You can see things like the current price, daily change, and percentage change. It’s simple to set up and use for a handful of stocks you’re keeping an eye on. However, it doesn’t offer much in terms of deep analysis or historical data right within the watchlist itself. You’re mostly seeing live snapshots.
- Limited Data Points: You can’t customize the columns to show things like P/E ratios, market cap, or historical performance directly in the main view.
- No Advanced Metrics: Forget seeing things like earnings per share (EPS), dividend yields, or financial statement summaries without leaving the watchlist.
- Basic Organization: While you can create multiple watchlists, there aren’t many options for sorting or filtering the stocks within them beyond alphabetical order.
The native watchlist is like a simple notepad for stock prices. It’s useful for jotting things down quickly, but it’s not a full-fledged financial analysis tool.
Expanding Functionality with Add-ons
This is where things get interesting. If you find the native watchlist a bit too basic, there are tools that can connect to Google Finance and give you a lot more power. Think of these as upgrades that bring more detailed information right into your spreadsheet.
One popular option is the Wisesheets add-on. It works with Google Sheets and can pull in a much wider range of data. You can get historical financials, key metrics, and even real-time data for thousands of securities, including stocks, ETFs, and cryptocurrencies. It uses special functions within Google Sheets to grab this information, making it easier to build custom dashboards and track performance more thoroughly.
Comparing Watchlist vs. Portfolio Features
It’s also important to distinguish between a watchlist and a portfolio in Google Finance. A watchlist is purely for monitoring. You add stocks you’re interested in, and you see their current market performance. It doesn’t track your actual investments.
A portfolio, on the other hand, is designed to track your actual holdings. When you add an investment to a portfolio, you specify the number of shares, the purchase date, and the price. Google Finance then calculates your gains and losses based on this information. It gives you a view of your investment’s performance over time, not just the stock’s market performance. You can even mark a portfolio as a ‘playground’ for practice without using real money.
Wrapping Up Your Stock Tracking
So, you’ve seen how Google Finance’s Watchlist can be a handy starting point for keeping an eye on your stocks. It’s pretty straightforward to set up and gives you a quick look at prices and news. But as we’ve explored, for more detailed analysis or to really dig into historical data and financial metrics, you might find its built-in features a bit limited. That’s where tools like the Wisesheets add-on come into play, offering a way to bring that deeper data right into Google Sheets. Whether you stick with the basics or decide to expand your toolkit, the main thing is having a system that works for you to stay informed about your investments.
Frequently Asked Questions
What is a Google Finance Watchlist?
A Google Finance Watchlist is like a personal list where you can keep an eye on stocks you’re interested in. It shows you their prices as they change throughout the day, along with other helpful info like news about the companies.
How do I start using my Google Finance Watchlist?
First, go to Google Finance and sign in. Then, look for the ‘Watchlist’ section. You can start adding stocks by typing in their names or symbols. It’s pretty simple to get going!
Can I see more than just the stock price?
Yes! You can choose what information you want to see. You can add columns for things like how much a company is worth (market cap) or its price compared to its earnings (P/E ratio). This helps you see what’s most important to you.
Does Google Finance Watchlist update prices instantly?
Pretty much! It shows you real-time price updates, meaning you see the latest prices as the stock market is open. This helps you track how your investments are doing right now.
Can I use Google Sheets with my watchlist?
Definitely! You can use a special formula called GOOGLEFINANCE in Google Sheets to pull stock data directly into your spreadsheet. This lets you create your own custom tracking tools and charts.
Are there any limits to Google Finance Watchlist?
Google Finance Watchlist is great for basic tracking, but it doesn’t give you super detailed info like past earnings reports or set up automatic price alerts. For more advanced features, you might need to look at other tools or add-ons.

Peyman Khosravani is a global blockchain and digital transformation expert with a passion for marketing, futuristic ideas, analytics insights, startup businesses, and effective communications. He has extensive experience in blockchain and DeFi projects and is committed to using technology to bring justice and fairness to society and promote freedom. Peyman has worked with international organizations to improve digital transformation strategies and data-gathering strategies that help identify customer touchpoints and sources of data that tell the story of what is happening. With his expertise in blockchain, digital transformation, marketing, analytics insights, startup businesses, and effective communications, Peyman is dedicated to helping businesses succeed in the digital age. He believes that technology can be used as a tool for positive change in the world.