So, you’ve been using Google Finance to keep an eye on your investments, which is pretty smart. It gives you a quick look at how things are doing. But maybe you’re wondering about getting money out of your investments, or perhaps you’ve heard the term ‘google finance portfolio cash withdrawal’ and are curious. While Google Finance itself doesn’t directly handle cash withdrawals like a bank, understanding how it tracks your holdings is the first step to managing your money effectively. This guide will break down how to use Google Finance for tracking, and touch on what you need to know when it comes to accessing your funds.
Key Takeaways
- Google Finance is a free tool to track your investments like stocks, ETFs, and crypto, showing their current value and performance.
- You manually add each purchase, including the number of shares, date, and price you paid.
- The platform offers basic charts and comparisons to market indexes, helping you see how your portfolio is doing overall.
- It doesn’t directly facilitate ‘google finance portfolio cash withdrawal’ because it’s a tracking tool, not a brokerage account.
- For actual cash withdrawals, you need to sell your holdings through your brokerage account and then transfer the funds.
Understanding Google Finance Portfolio Capabilities
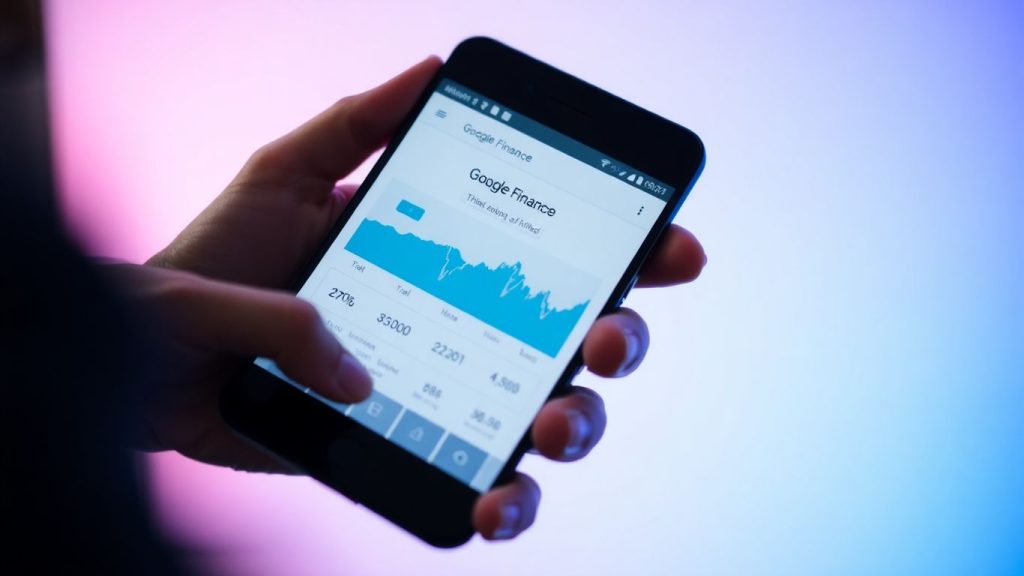
Google Finance offers a straightforward tool for tracking your investments, acting as a central hub for a quick look at your financial holdings. It’s designed to be accessible, allowing you to input your stocks, exchange-traded funds (ETFs), and even some cryptocurrencies to see how they’re performing. The platform pulls in real-time market data, so you can get a sense of your portfolio’s current value and its daily fluctuations without much fuss.
Overview of Google Finance Portfolio Features
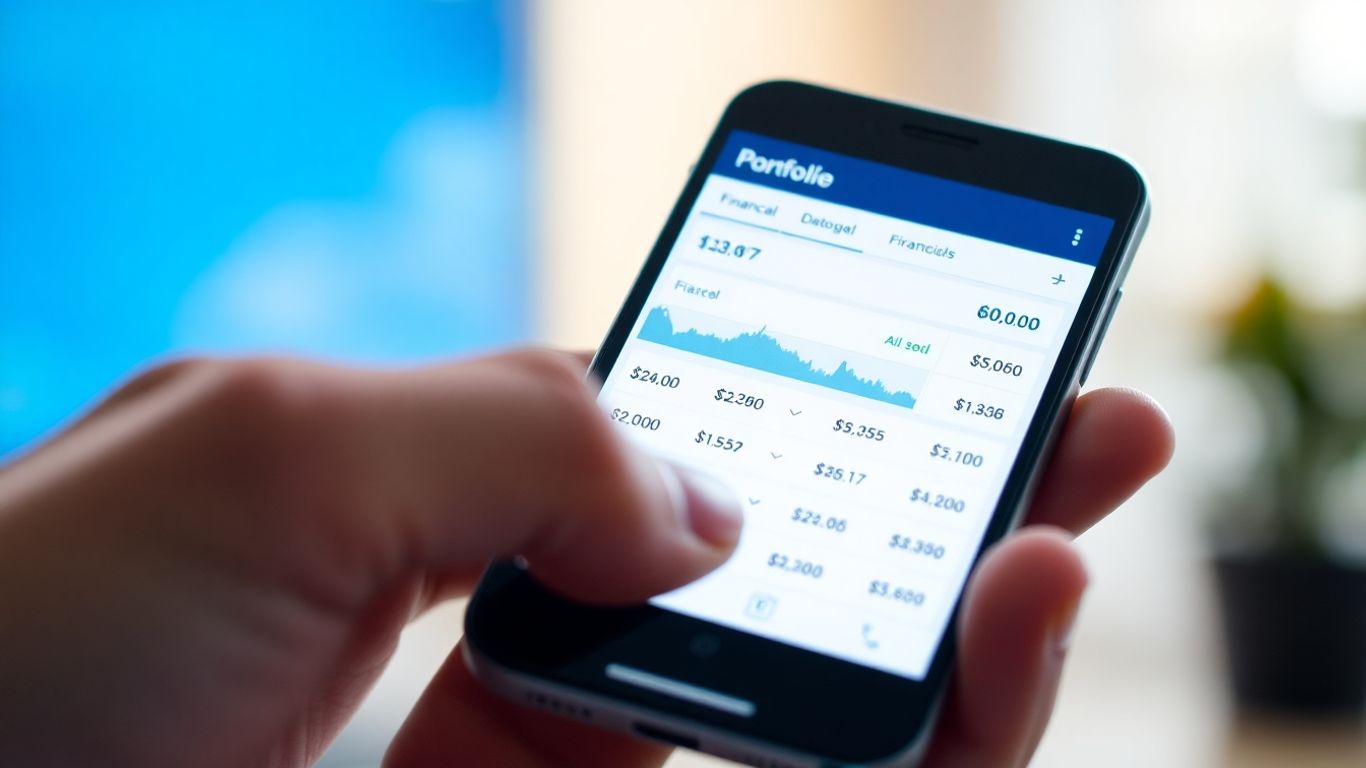
When you set up a portfolio in Google Finance, you’re essentially creating a digital ledger. You manually add each investment, specifying the ticker symbol, the number of shares or units, the purchase date, and the price you paid. Google Finance then takes this information and calculates key metrics for you. This includes:
- Total Portfolio Value: The current market worth of all your combined holdings.
- Cost Basis: The total amount you’ve spent to acquire your investments.
- Gains and Losses: Both the absolute dollar amount and the percentage change from your initial investment.
- Daily Performance: How much your portfolio has moved up or down in the current trading session.
It also provides basic charts showing your portfolio’s value over time and allows for comparisons against major market indexes like the S&P 500. Additionally, you can find curated news related to the companies you’re invested in, helping you stay informed about market events that might affect your holdings.
Key Strengths for Investors
One of the main advantages of using Google Finance for portfolio tracking is its simplicity and cost. It’s free to use, requiring only a Google account, and the interface is quite intuitive. For individuals who are just starting out or who prefer not to deal with complex software, this tool offers a good entry point. It automates the calculations, saving you the time and potential errors of manual spreadsheet work. The real-time quotes are also a significant plus, giving you up-to-date information without needing to constantly check different financial sites. This makes it easy to get a snapshot of your investment performance at any given moment.
While Google Finance provides a useful overview, it’s important to recognize its limitations. It’s primarily a tracking tool, not an analytical platform. For more in-depth analysis or to explore strategies like those used in hedge funds, you might need to look at more specialized software.
Limitations for Advanced Users
However, Google Finance’s portfolio tracker isn’t designed for every type of investor. A major drawback is the lack of automatic syncing with brokerage accounts. This means every transaction, whether a buy or a sell, must be entered manually. For those with multiple accounts or frequent trading activity, this can become quite time-consuming and prone to errors. Furthermore, the tool has a limited scope of assets it can track. It supports stocks, ETFs, and some cryptocurrencies, but it doesn’t natively track cash balances, bonds, or other asset classes like real estate. This can lead to an incomplete picture of your overall net worth. The analytical features are also quite basic; you won’t find advanced charting tools, risk assessment features, or scenario planning capabilities that more sophisticated investors might require.
Setting Up Your Google Finance Portfolio
Getting your investments organized in Google Finance is a straightforward process, designed to give you a quick overview of your holdings. It’s a good starting point for anyone looking to consolidate their investment tracking without needing complex software. You’ll need a Google account to begin, and then it’s just a matter of creating a new portfolio and populating it with your investments.
Creating a New Portfolio
To start, head over to google.com/finance. Once you’re logged in with your Google account, you’ll see an option to create a new portfolio. Look for the "Your portfolios" section on the right side of the page and click the "New portfolio" button. You’ll then be prompted to give your portfolio a name. Something descriptive like "My Investment Holdings" or "Retirement Fund Tracker" works well. After entering a name, just click "Done."
Adding Your Investments
With your portfolio created, the next step is to add the individual investments you hold. Click on the "Add investments" button. You can then search for a specific stock, ETF, or cryptocurrency using its ticker symbol (like AAPL for Apple, or BTC for Bitcoin). Once you select your investment, you’ll need to enter a few details: the number of shares or units you own, the date you purchased them, and the price you paid. If you made multiple purchases of the same investment over time, you can add those as separate entries by clicking "More purchases." This detailed entry helps Google Finance accurately calculate your gains and losses.
Naming and Saving Your Portfolio
As mentioned, naming your portfolio is part of the creation process. A clear name helps you distinguish between different tracking goals, perhaps one for long-term investments and another for more speculative trades. After adding your initial investments, make sure to save your progress. Google Finance usually saves automatically as you add information, but it’s always good practice to double-check. The platform supports a range of assets, including stocks, ETFs, and cryptocurrencies, but it’s important to remember that it doesn’t automatically track cash balances or bonds, so you’ll need to account for those separately if they are part of your overall financial picture. For those interested in more advanced tracking, consider exploring how the GOOGLEFINANCE function can be used within Google Sheets for a more customized approach.
While Google Finance offers a convenient way to set up a portfolio, it’s important to note that all data entry is manual. There are no automatic connections to brokerage accounts, which means you’ll need to input every transaction yourself. This can become time-consuming if you have many trades or multiple accounts to track.
Managing Your Investment Holdings
Once you’ve set up your Google Finance portfolio, the next step is to accurately reflect your actual investments. This means adding, removing, or updating the details of your holdings. Getting this right is key to ensuring your portfolio’s performance data is accurate.
Adding Multiple Purchases of an Investment
It’s common to buy shares of the same stock or fund at different times and at different prices. Google Finance allows you to record each of these transactions separately. When you add an investment, you’ll see an option to add "More purchases." Clicking this lets you input the number of shares, the date of purchase, and the price paid for each additional transaction. This detailed record-keeping is important for calculating your true cost basis and overall returns.
- Enter the initial purchase details.
- Click "More purchases" to add subsequent buys.
- Input the quantity, date, and price for each additional lot.
- Save all entries to update your holdings.
Removing Investments from Your Portfolio
If you’ve sold an investment, you’ll need to remove it from your Google Finance portfolio to keep your data current. To do this, navigate to your portfolio, find the investment you wish to remove, and look for an option to delete or remove it. Be aware that removing an investment will take it out of your performance calculations going forward. If you’re just looking to see how your portfolio would perform without a certain asset, you can also view your portfolio as a watchlist, which doesn’t delete your investment data.
Updating Existing Holdings
While Google Finance automatically updates stock prices, it doesn’t automatically track corporate actions like stock splits or dividend reinvestments. If such an event occurs, you may need to manually adjust your holdings. For instance, if a stock splits 2-for-1, you’ll need to double the number of shares you hold and halve the average purchase price per share to reflect the change accurately. Similarly, if you reinvest dividends, you’ll need to add those as new purchases. This manual oversight is part of maintaining an accurate investment tracker.
Keeping your holdings updated is more than just a housekeeping task; it directly impacts the accuracy of your performance metrics. Small discrepancies can grow over time, leading to a skewed view of your investment success.
For those new to investing, starting with simpler assets like stocks and ETFs is often recommended. You can begin by learning about spot trading and long-term holding strategies, which are accessible entry points into the world of crypto trading. As your experience grows, you can explore more complex investment types.
Analyzing Your Portfolio’s Performance
Once you’ve got your investments logged into Google Finance, the next logical step is to see how they’re actually doing. This section is all about understanding the numbers that tell the story of your portfolio’s journey. It’s not just about seeing a big number; it’s about understanding what that number means and how it got there.
Viewing Your Portfolio’s Value Over Time
Google Finance provides a straightforward way to visualize your portfolio’s growth (or decline) over different periods. When you look at your portfolio, you’ll see a main chart. This chart is your visual history book. It shows how the total value of your investments has changed from the day you started adding them up to the present moment. You can click on different timeframes like ‘1M’ (one month), ‘6M’ (six months), ‘YTD’ (year-to-date), or even select custom date ranges to get a clearer picture of performance during specific market conditions or holding periods.
Understanding Total Returns and Daily Changes
Beyond just the total value, Google Finance breaks down your performance into key metrics. You’ll typically find a section highlighting ‘1 Day’ returns and ‘Total’ returns. The ‘1 Day’ return shows you how much your portfolio has gained or lost in value over the previous trading day. This gives you a sense of short-term market reactions. ‘Total’ returns, on the other hand, measure your performance from the moment you first invested up to the current value. This is calculated by comparing your portfolio’s current worth to the total cost basis – essentially, what you originally paid for all your holdings.
It’s important to remember that ‘Total Returns’ in Google Finance are based on the purchase prices you manually entered. If you’ve made adjustments or have complex cost basis situations, this figure might need further verification.
Comparing Your Portfolio to Market Benchmarks
Knowing how your portfolio is doing is one thing, but knowing how it’s doing relative to the broader market is another. Google Finance allows you to compare your portfolio’s performance against common market benchmarks, such as the S&P 500. This comparison helps you gauge whether your investment strategy is outperforming, underperforming, or keeping pace with the general market trends. To do this, you’ll usually find a ‘Compare to’ option below your performance chart. You can select a suggested benchmark or search for a specific index or even another asset to see how your holdings stack up.
Here’s a quick look at what you might see:
- Portfolio Value: The current total worth of all your investments.
- 1 Day Return: The percentage change in value from the previous trading day’s close.
- Total Return: The overall percentage gain or loss since you started tracking the portfolio.
- Benchmark Comparison: How your portfolio’s performance measures up against a chosen market index.
This comparative analysis is key to understanding if your investment choices are effective in the larger economic landscape.
Leveraging Google Sheets for Investment Tracking
While Google Finance offers a solid platform for managing your investment portfolio, sometimes you need a bit more flexibility and customization. This is where Google Sheets really shines. By combining the power of Google Sheets with the built-in GOOGLEFINANCE function, you can create a dynamic and personalized investment tracker that goes beyond what a standard portfolio tool might offer.
Utilizing the GOOGLEFINANCE Function
The GOOGLEFINANCE function is the cornerstone of building your custom tracker. It’s a built-in formula that pulls real-time (with a slight delay) and historical financial data directly into your spreadsheet. You don’t need to be a spreadsheet wizard to get started; the basic syntax is quite straightforward.
To get the current price of a stock, you simply need its ticker symbol. For instance, to fetch the current price for Alphabet (Google’s parent company), you’d use:
=GOOGLEFINANCE("GOOG", "price")
But this function can do much more than just fetch current prices. You can retrieve a wealth of information, including:
- Previous day’s closing price:
=GOOGLEFINANCE(A2, "closeyest") - 52-week high and low:
=GOOGLEFINANCE(A2, "high52")and=GOOGLEFINANCE(A2, "low52") - Market capitalization:
=GOOGLEFINANCE(A2, "marketcap") - Price-to-earnings (P/E) ratio:
=GOOGLEFINANCE(A2, "pe") - Daily trading volume:
=GOOGLEFINANCE(A2, "volume")
These attributes can be placed in columns next to your list of ticker symbols (assuming your tickers are in column A, starting from A2) to build out a comprehensive view of your holdings.
Accessing Historical Investment Data
Beyond current market data, the GOOGLEFINANCE function is incredibly useful for analyzing past performance. You can specify a date range to pull historical prices, which is great for understanding trends or calculating your own performance metrics.
For example, to see the daily closing prices for a stock between two specific dates, you could use a formula like this:
=GOOGLEFINANCE("GOOG", "price", DATE(2025, 2, 1), DATE(2025, 2, 10), "DAILY")
This would return a table showing the closing price for each day from February 1st to February 10th, 2025. This capability allows you to build charts and perform deeper analysis on how your investments have moved over time.
Building a Custom Investment Tracker
Creating your own tracker involves a few simple steps. First, open a new Google Sheet or an existing one. Give it a clear name, like "My Investment Portfolio." Then, set up your column headers. A good starting point would be:
| Ticker Symbol | Company Name | Current Price | 52-Week High | P/E Ratio | Your Holdings | Total Value |
|---|
In the ‘Ticker Symbol’ column, list the symbols for your investments (e.g., AAPL, MSFT, VOO). In the subsequent columns, use the GOOGLEFINANCE function, referencing the ticker symbol in its respective cell, to pull the data you want to display. For instance, if your ticker is in cell A2, the formula for ‘Current Price’ would be =GOOGLEFINANCE(A2, "price"). You can then manually enter your ‘Your Holdings’ (number of shares) and use a simple formula like =B2*C2 (assuming ‘Current Price’ is in column C and ‘Your Holdings’ is in column B) to calculate the ‘Total Value’.
While Google Sheets offers a robust way to track investments, remember that the data has a slight delay. For critical, real-time trading decisions, always cross-reference with a live trading platform.
Advanced Portfolio Management Considerations
While Google Finance offers a straightforward way to track your investments, it’s important to recognize its limitations, especially as your financial picture becomes more complex. It’s a great starting point, but for serious investors, you might find yourself needing more.
Limitations in Asset Coverage
Google Finance primarily focuses on stocks, ETFs, and mutual funds. While it does allow for manual entry of cryptocurrencies, its support for digital assets isn’t as robust as dedicated crypto tracking platforms. If you hold a diverse range of assets, including alternative investments or a large number of different cryptocurrencies, you might find Google Finance’s coverage a bit thin. It doesn’t automatically pull in data for every single asset class out there.
The Importance of Manual Data Entry
One of the biggest differences between Google Finance and more advanced tools is the data input method. Google Finance relies heavily on you manually entering every purchase, sale, and dividend. This can be time-consuming and, frankly, prone to errors. Forgetting to log a small dividend or mistyping a purchase price can throw off your overall performance numbers. This manual process is where most users encounter issues as their portfolio grows.
Here’s a quick look at how manual entry compares:
| Feature | Google Finance Portfolio | Advanced Tools (e.g., PinkLion) |
|---|---|---|
| Data Input | Manual entry required | Auto-sync via broker, CSV upload |
| Updates | Manual updates needed | Automatic, real-time sync |
| Error Potential | Higher | Lower |
| Time Investment | Significant | Minimal |
When to Consider Alternative Tools
If you’re managing a simple portfolio with just a few stocks or ETFs, Google Finance might serve you well. However, several signs suggest it’s time to look elsewhere:
- Significant Portfolio Size: When your portfolio grows to include dozens or hundreds of holdings across different asset classes.
- Frequent Trading Activity: If you buy and sell investments often, the manual entry becomes a major chore.
- Need for Advanced Analytics: You want to perform "what-if" scenario analysis, get AI-driven insights, or see detailed risk assessments.
- Desire for Automation: You’d prefer your portfolio to update automatically by linking to your brokerage accounts.
- Inclusion of Complex Assets: You hold assets like options, futures, or a wide variety of cryptocurrencies that Google Finance doesn’t fully support.
While Google Finance provides a free and accessible way to monitor basic investment performance, its manual nature and limited analytical features mean it’s best suited for beginners or those with very straightforward investment strategies. As your investment journey progresses, exploring platforms that offer automated data import and deeper analytical capabilities becomes increasingly practical.
Wrapping Up Your Google Finance Portfolio
So, you’ve learned how to set up and manage your investments using Google Finance. It’s a straightforward tool for getting a quick look at your portfolio’s performance, especially if you’re just starting out or have a simpler collection of assets. Remember, it’s great for a basic overview, but for more complex needs or if you want automated updates, you might eventually look into other options. For now, though, you’ve got the steps to keep your Google Finance portfolio organized and visible.
Frequently Asked Questions
Can I link my bank account or brokerage to Google Finance?
No, Google Finance doesn’t connect directly to your bank or investment accounts. You have to manually enter all your investment details, like when you bought something and how much you paid for it. It’s like keeping a personal record book for your money.
What types of investments can I track on Google Finance?
You can track stocks, exchange-traded funds (ETFs), mutual funds, and even some cryptocurrencies. However, it doesn’t have a place to track things like cash you have saved or bonds.
Does Google Finance give advice on what to buy or sell?
Google Finance is like a scoreboard; it shows you how your investments are doing. It doesn’t offer any advice or suggestions on what you should do next, like rebalancing your investments or flagging potential problems.
How often does the price information update?
The prices you see on Google Finance are usually updated in real-time or very close to it, meaning you get a pretty current picture of your investments’ value throughout the trading day.
Can I see how my investments compare to the overall market?
Yes! Google Finance lets you compare your portfolio’s performance to major market indexes, such as the S&P 500. This helps you see if your investments are doing better or worse than the general market.
What if I have a lot of investments or complex ones?
For a few investments, Google Finance is great. But if you have many different accounts, or investments like bonds or real estate, you might find it gets tricky to manage all the manual entry. In those cases, other tools might be more helpful.

Peyman Khosravani is a global blockchain and digital transformation expert with a passion for marketing, futuristic ideas, analytics insights, startup businesses, and effective communications. He has extensive experience in blockchain and DeFi projects and is committed to using technology to bring justice and fairness to society and promote freedom. Peyman has worked with international organizations to improve digital transformation strategies and data-gathering strategies that help identify customer touchpoints and sources of data that tell the story of what is happening. With his expertise in blockchain, digital transformation, marketing, analytics insights, startup businesses, and effective communications, Peyman is dedicated to helping businesses succeed in the digital age. He believes that technology can be used as a tool for positive change in the world.