
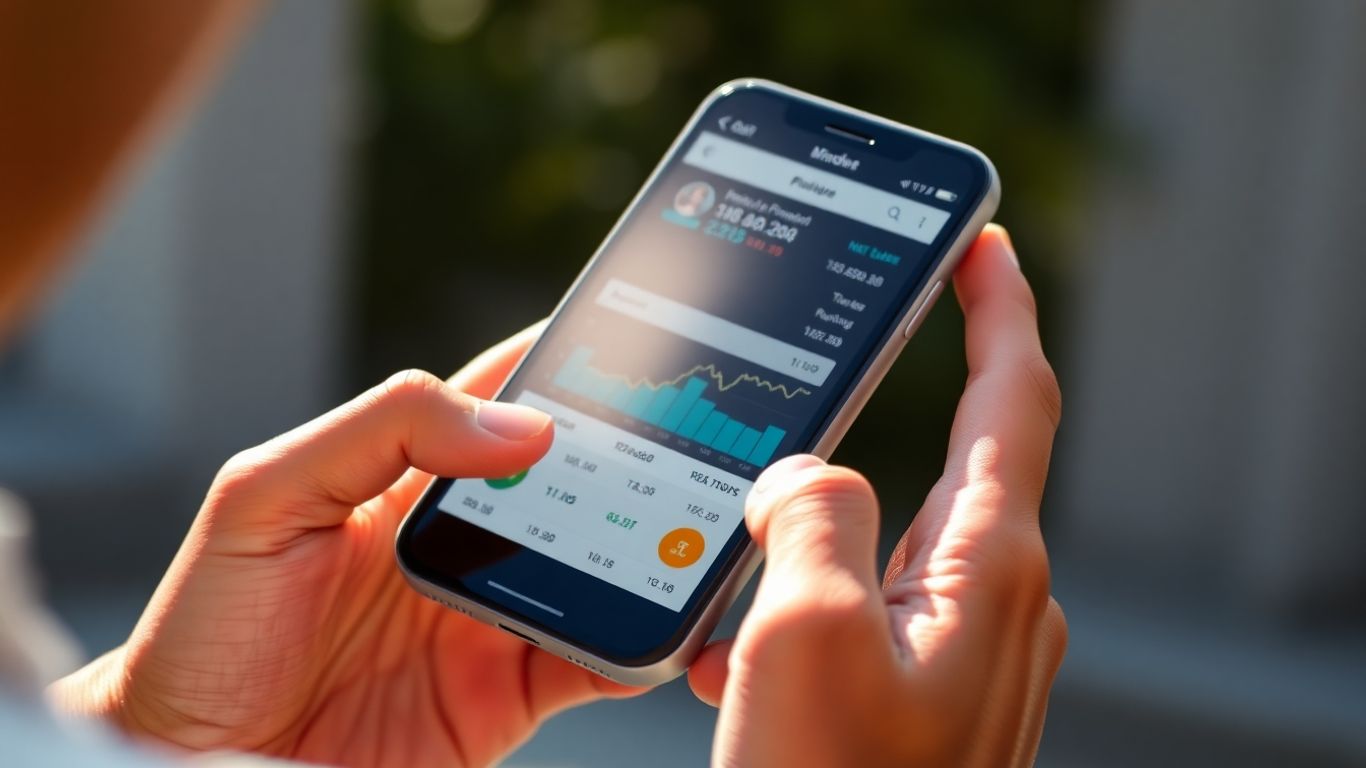
Managing your investments can feel like a lot, especially with all the different places your money is. Google Finance offers a way to see it all in one spot. This guide is all about using the Google Finance portfolio tool to keep track of your stocks, ETFs, and even crypto. We’ll cover how to set it up, what you can see, and some simple ways to make it work better for you. It’s a good starting point for anyone wanting a clearer picture of their investments without getting too complicated.
Key Takeaways
- Google Finance provides a free, straightforward tool to track your investment holdings like stocks, ETFs, and cryptocurrencies in one place.
- Setting up a google finance portfolio involves creating a new portfolio and manually inputting details for each investment, including purchase date and price.
- The tool offers basic performance metrics, charts showing value over time, and comparisons against market indices, giving a quick overview of your portfolio’s health.
- While useful for a simple snapshot, the google finance portfolio tracker lacks automation for syncing with brokers and advanced analytical features.
- For more complex needs or deeper analysis beyond basic tracking, users might eventually need to consider more specialized investment management tools.
Getting Started With Google Finance Portfolios
Setting up your investment tracking with Google Finance is a straightforward process, designed to give you a clear view of your holdings. This tool acts as a central hub, allowing you to monitor stocks, exchange-traded funds (ETFs), and even cryptocurrencies all in one place. It’s a great starting point for anyone looking to get a handle on their financial picture without needing complex software.
Understanding The Google Finance Portfolio Tool
The Google Finance portfolio feature is essentially a digital ledger for your investments. It allows you to manually input your purchases and then tracks their current value based on real-time market data. Think of it as a personal dashboard where you can see how your money is performing at a glance. While it doesn’t automatically connect to your brokerage accounts, this manual approach gives you complete control over what data is entered and how it’s organized. It’s important to know that this tool is passive; it shows you the numbers but doesn’t offer automated advice or rebalancing suggestions. For those interested in alternative investments, remember that they often come with unique considerations, and thorough research is always advised before adding them to your mix understanding alternative investments.
Accessing Your Google Finance Account
To start using the portfolio tool, you’ll need a Google account. If you already use Gmail, Google Drive, or other Google services, you can use those same login details. Simply head over to the Google Finance website. Once you’re there, you’ll see an option to sign in. After signing in, you’ll be able to find the portfolio section, usually located prominently on the page. It’s designed to be easily accessible, so you can start building your portfolio right away.
Creating Your First Portfolio
Creating your first portfolio is simple. After signing in to Google Finance, look for an option like "New portfolio" or a plus (+) icon. You’ll be prompted to give your portfolio a name – something descriptive like "My Retirement Fund" or "2025 Investments" works well. Once named, you’ll hit ‘Done’ or ‘Create’, and your empty portfolio will be ready for you to start adding your investments. This initial setup is quick, usually taking less than a minute, and sets the stage for all your tracking needs.
Adding And Managing Investments
Once you’ve got your portfolio set up, the next step is to actually put your investments into Google Finance. This is where you’ll start seeing your money grow, or, well, do whatever it’s doing. It’s pretty straightforward, but you’ll want to be accurate with the details.
Inputting Stock, ETF, And Cryptocurrency Holdings
Adding your holdings is the core of building your portfolio. You’ll need to search for the specific ticker symbol for each investment. Whether it’s a well-known stock like Apple (AAPL), an exchange-traded fund (ETF) such as the Vanguard S&P 500 ETF (VOO), or a cryptocurrency like Bitcoin (BTC), Google Finance can track them. Just type the symbol into the search bar when you’re adding an investment. It’s important to select the correct one from the dropdown list to avoid tracking the wrong asset. This is how you start to get a clear picture of what you own.
Recording Purchase Details
After selecting your investment, you’ll need to input the details of your purchase. This includes:
- Quantity: How many shares, units, or coins you bought.
- Purchase Date: The exact date you made the transaction.
- Purchase Price: The price per share, unit, or coin, before any commissions or fees. This is important for calculating your cost basis accurately.
Getting these details right is key. If you’re unsure about the exact purchase price, check your brokerage statements. For a more complex strategy, you might look into options like those offered by hedge funds, but for most individual investors, sticking to the basics here is best.
Adding Multiple Transactions
Most investors don’t just buy one thing once. You might have bought shares of the same stock at different times or at different prices. Google Finance allows you to record these multiple transactions for a single holding. When you’re entering the purchase details, look for an option like "More purchases" or a similar prompt. This lets you add additional buy orders for the same ticker symbol, each with its own date and price. This is super helpful for accurately tracking your average cost and overall performance, especially if you’ve been investing for a while and have a history of dollar-cost averaging or buying on dips.
Keeping your transaction data clean and accurate is the foundation of understanding your portfolio’s performance. Small errors here can snowball into misleading results later on, so take your time with this step.
By diligently inputting each purchase, you’re building a reliable record that Google Finance will use to show you how your investments are performing over time. It might seem a bit tedious at first, but it’s a necessary step for any serious investor.
Analyzing Your Portfolio Performance
Once you’ve added your investments to Google Finance, the next logical step is to figure out how they’re actually doing. This section breaks down how to look at the numbers and what they mean for your money.
Reviewing Key Performance Metrics
Google Finance provides a straightforward overview of your portfolio’s health. When you look at your portfolio, you’ll typically see a few main figures right away. These include:
- Total Portfolio Value: This is the current market value of all your holdings combined. It’s what your investments are worth right now.
- Total Cost: This represents the total amount of money you initially spent to acquire all your investments. It’s your basis.
- Overall Gain/Loss: This is the difference between your total portfolio value and your total cost. It’s shown in both dollar amounts and as a percentage, giving you a quick sense of your profit or loss.
Below these summary figures, you’ll usually find a list of each individual holding. For each investment, you can see its current price, how much it has changed today, and its own gain or loss since you bought it. This detailed view helps you pinpoint which specific investments are performing well and which might be lagging.
Interpreting Portfolio Value Over Time
Looking at your portfolio’s value over time is like checking the pulse of your investments. Google Finance offers a line chart that visualizes how your total portfolio value has changed from the day you started tracking it. This chart is a simple yet effective tool for understanding the growth trajectory of your investments.
When you examine this chart, pay attention to the overall trend. Is the line generally moving upwards, indicating growth? Or is it fluctuating significantly, or perhaps trending downwards? You can hover over different points on the chart to see the exact value on specific dates. This can help you identify periods of strong performance or significant downturns. It’s a good way to see the impact of market events or your own investment decisions over the long haul.
Understanding the historical performance of your portfolio is key to making informed decisions about its future. It helps you see patterns and understand how your investments react to different market conditions.
Comparing Against Market Indices
It’s not enough to know how your portfolio is doing in isolation; you also need to see how it stacks up against the broader market. Google Finance often includes a comparison feature, allowing you to benchmark your portfolio’s performance against major market indices like the S&P 500. This comparison is usually displayed on the same performance chart.
- Benchmark: The S&P 500 is a common benchmark representing the performance of 500 large U.S. companies. It’s widely used as an indicator of the overall stock market’s health.
- Relative Performance: By seeing your portfolio’s line alongside the index’s line, you can quickly tell if you’ve outperformed, underperformed, or matched the market’s returns over a given period.
- Context: This comparison provides valuable context. If your portfolio is up 5% but the S&P 500 is up 10%, you might have underperformed the market, even though you made money. Conversely, if your portfolio is down 2% and the market is down 5%, you’ve actually outperformed the index. This helps you evaluate the effectiveness of your investment strategy relative to general market trends. For more on tracking market performance, consider looking into how professional agencies use tools like Google Analytics to monitor data.
This comparative analysis is vital for assessing whether your investment choices are generating returns that justify the risks taken, especially when compared to simply investing in a broad market index fund.
Leveraging Google Finance Features
Google Finance offers several tools that go beyond just tracking your portfolio’s value. These features can help you stay informed and make more thoughtful investment decisions. Let’s look at how you can use them.
Utilizing Real-Time Quotes And News
Staying current with market movements is key. Google Finance provides real-time stock quotes, meaning you see the latest prices as they happen. This is incredibly useful for active traders or anyone who wants to know the immediate value of their holdings. Beyond just prices, the platform also aggregates financial news relevant to the companies you’re following. This means you can often see news that might affect a stock’s price right alongside its quote. It’s a way to connect market action with the reasons behind it, without having to jump between different websites. You can get a quick overview of what’s moving the markets for your specific investments.
Exploring Basic Charts And Analytics
Visualizing your investments can make a big difference in understanding their performance. Google Finance includes interactive charts that show historical price data for stocks, ETFs, and other assets. You can adjust the time frame to see performance over days, months, or years. These charts aren’t just pretty pictures; they can help you spot trends and patterns. While they offer basic technical analysis tools, like moving averages, they provide a good starting point for visual analysis. You can also compare the performance of different assets side-by-side on these charts, which is helpful when deciding where to allocate new funds or rebalance your existing portfolio. For more advanced charting, you might consider looking into dedicated charting platforms or exchanges that offer robust tools.
Setting Up Stock Alerts
It’s not always practical to be glued to your screen. Google Finance allows you to set up alerts for specific stocks or other financial instruments. You can configure these alerts to notify you when a stock reaches a certain price, either a target selling price or a price you’d consider buying at. This feature acts like a personal market assistant, letting you know about significant price movements even when you’re busy. It helps you react to market changes promptly, which can be important for managing risk and seizing opportunities. Setting up alerts is a straightforward process, usually involving selecting the asset, choosing the alert condition (e.g., price reaches X), and deciding how you want to be notified (e.g., email).
These built-in features help bridge the gap between simply tracking your portfolio and actively managing it. By staying informed about real-time prices, relevant news, and setting up timely alerts, you can make more informed decisions about your investments.
Here’s a quick look at what you can monitor:
- Real-time Prices: See the current market value of your holdings.
- Related News: Access financial news impacting specific assets.
- Price Alerts: Get notified when prices hit your predefined levels.
- Historical Charts: Visualize performance over various time periods.
Advanced Strategies And Integrations
While Google Finance offers a solid foundation for tracking your investments, you can really take things up a notch by exploring more advanced features and connecting it with other tools. This is where you move beyond just watching your portfolio and start actively shaping it with more sophisticated methods.
Comparing Multiple Investments on Charts
Google Finance’s charting tools aren’t just for looking at one stock. You can actually overlay the performance of several different investments on a single chart. This is super helpful for seeing how your holdings stack up against each other, or how they’ve performed relative to a benchmark index. To do this, you typically add one investment to the chart, and then look for an option to ‘Add comparison’ or ‘Add symbol’. You can then type in the ticker symbols for other stocks, ETFs, or even cryptocurrencies you want to compare. This visual comparison makes it much easier to spot trends, understand relative strengths, and make informed decisions about rebalancing.
Integrating with Google Sheets
This is where things get really powerful. Google Sheets, combined with Google Finance, can become a custom dashboard for your entire financial life. You can use the GOOGLEFINANCE() function directly in Sheets to pull real-time stock prices, historical data, company financials, and more. This allows you to build custom performance reports, calculate specific metrics not available on the main Google Finance site, and even track things like dividend income or capital gains.
Here’s a basic example of how you might use it:
| Ticker | Current Price | Your Cost Basis | Unrealized Gain/Loss |
|---|---|---|---|
| GOOG | =GOOGLEFINANCE("GOOG", "price") | 1500 | =(B2*C2)-C2 |
| AAPL | =GOOGLEFINANCE("AAPL", "price") | 100 | =(B3*C3)-C3 |
Beyond the basic function, you can also explore add-ons for Google Sheets that connect to various financial data providers. These can offer more detailed company reports, analyst ratings, or specialized market data that Google Finance itself doesn’t provide.
Understanding Data Limitations
It’s important to remember that no tool is perfect, and Google Finance has its limits. The data, while generally good, might have slight delays or occasional inaccuracies, especially for less common assets or during periods of extreme market volatility. Also, the platform is primarily focused on tracking and basic analysis; it doesn’t offer sophisticated trading tools or in-depth financial planning advice. For highly complex strategies or when absolute real-time data is critical, you might need to look at professional-grade platforms. Always cross-reference important data points if you’re making significant decisions based on them.
While Google Finance is a fantastic free tool for most individual investors, it’s wise to be aware of its limitations. It provides a great overview and tracking capabilities, but for deep dives into company fundamentals or complex portfolio optimization, you might need to supplement it with other resources or specialized software. Think of it as your reliable daily newspaper for the market, not your crystal ball for predicting every move.
Optimizing Your Investment Strategy
Once you’ve got your investments logged into Google Finance and have a handle on how they’re performing, the next step is to really fine-tune things. This isn’t just about watching numbers go up and down; it’s about making sure your portfolio is set up to meet your personal financial goals, whatever they might be.
Asset Allocation Considerations
Asset allocation is basically how you divide your investment money among different categories, like stocks, bonds, and cash. The idea is that different types of assets behave differently in various market conditions. Spreading your money around can help reduce overall risk. For example, if stocks are having a bad day, maybe your bonds are doing okay, which helps balance things out.
- Diversification: Don’t put all your eggs in one basket. Invest across different industries and company sizes. If one sector tanks, others might hold steady or even grow.
- Risk Tolerance: How much risk are you comfortable with? Younger investors might take on more risk for potentially higher returns, while those closer to retirement might prefer a more conservative approach.
- Time Horizon: How long do you plan to invest? Longer time frames generally allow for more aggressive strategies, as there’s more time to recover from market downturns.
A well-thought-out asset allocation is like building a sturdy house. The foundation needs to be solid, and each room (asset class) plays a specific role in the overall structure and stability.
Risk Management Techniques
Managing risk means trying to protect your portfolio from big losses. It’s not about avoiding risk altogether – that’s impossible if you want to grow your money – but about controlling it.
- Stop-Loss Orders: These are instructions to sell an investment if it drops to a certain price. It’s a way to limit how much you can lose on a single trade.
- Regular Rebalancing: Over time, some investments will grow faster than others, throwing your original allocation out of whack. Rebalancing means selling some of the winners and buying more of the underperformers to get back to your target mix.
- Understanding Correlation: Know how your different investments tend to move together. If two assets always move in the same direction, they don’t offer much diversification benefit against each other.
Regular Portfolio Review
Your portfolio isn’t a ‘set it and forget it’ thing. The market changes, your life changes, and your goals might change too. So, you need to check in regularly.
- Schedule Check-ins: Whether it’s quarterly or semi-annually, set a time to look at your portfolio. Google Finance makes it easy to see your performance at a glance.
- Review Performance Against Goals: Are you on track to meet your financial objectives? If not, what needs to change?
- Stay Informed: Keep up with major economic news and how it might affect your investments. This helps you make informed decisions during your reviews.
Making these adjustments and reviews a habit will help ensure your investment strategy stays aligned with your financial journey.
Moving Forward with Your Investments
So, we’ve walked through setting up your portfolio in Google Finance, looking at its charts, and understanding the basic numbers it shows. It’s a solid starting point, especially when you’re just getting your investments organized. You can see your total value, how things are doing today, and even compare your performance to a major index. But remember, Google Finance is best for a quick look. As your investments grow or get more complicated, you might find yourself wanting more detailed analysis or automatic updates. That’s perfectly normal. The key is to start somewhere, and Google Finance offers a free, accessible way to do just that. Keep learning, keep tracking, and don’t be afraid to explore other tools as your financial journey continues.
Frequently Asked Questions
What exactly is Google Finance and how can it help me with my investments?
Think of Google Finance as your free online helper for watching your money grow. It lets you keep track of stocks, ETFs, and even some cryptocurrencies all in one spot. You can see how much they’re worth right now, how much you paid for them, and if you’re making or losing money. It’s like having a digital notebook for your investments.
How do I start using Google Finance to track my investments?
Getting started is super easy! First, you need a Google account. Then, just go to the Google Finance website. Look for an option like ‘New portfolio,’ give your portfolio a name (like ‘My Summer Investments’), and click to create it. After that, you can start adding the stocks or other things you’ve invested in.
Can I add all my different types of investments to Google Finance?
You can add stocks, exchange-traded funds (ETFs), and many cryptocurrencies. When you add an investment, you’ll need to tell it how many shares or units you have, when you bought them, and how much you paid. It’s important to remember that Google Finance doesn’t track things like cash or bonds directly, so you might have gaps if those are a big part of your money.
Does Google Finance automatically update my investment information?
Google Finance shows you live prices for your investments, which is great! However, it doesn’t automatically connect to your bank or investment accounts. This means you have to manually type in every time you buy or sell something. For a few investments, this is fine, but if you have many, it can become a bit of a chore.
How can I see if my investments are doing well?
Once you’ve added your investments, Google Finance shows you important numbers. You can see your total investment value, how much you’ve spent in total, and your total profit or loss. It also shows you how your investments are doing compared to big market groups like the S&P 500, and you can look at simple charts to see how your portfolio’s value has changed over time.
What are the main things Google Finance *can’t* do for my investments?
While Google Finance is a helpful free tool, it has limits. It doesn’t give you advice on how to change your investments, it won’t automatically rebalance things for you, and it can’t track all types of assets like cash or bonds. Also, the analysis tools are pretty basic, so if you have a lot of complex investments, you might need to look at other, more advanced tools later on.

Peyman Khosravani is a global blockchain and digital transformation expert with a passion for marketing, futuristic ideas, analytics insights, startup businesses, and effective communications. He has extensive experience in blockchain and DeFi projects and is committed to using technology to bring justice and fairness to society and promote freedom. Peyman has worked with international organizations to improve digital transformation strategies and data-gathering strategies that help identify customer touchpoints and sources of data that tell the story of what is happening. With his expertise in blockchain, digital transformation, marketing, analytics insights, startup businesses, and effective communications, Peyman is dedicated to helping businesses succeed in the digital age. He believes that technology can be used as a tool for positive change in the world.