Bitcoin (BTC)

On June 25, Bitcoin opened at a price of $30,465.3. It initially showed promise as it climbed to $30,533.6, reaching a high of $31,040.2. However, it faced resistance and dipped to $30,315.8, recording a loss of 0.22%. The trading volume stood at 37.12K Bitcoin.
Moving to June 26, the cryptocurrency continued its volatile journey. Opening at $30,267.0, it briefly rose to $30,466.3 before dropping to $29,986.3. Bitcoin experienced a decline of 0.65% and a trading volume of 58.71K.
June 27 brought a slight recovery for Bitcoin. Starting at $30,689.1, it gained momentum and reached $30,993.7, resulting in a 1.39% increase. The trading volume during this period was 55.82K Bitcoin.
However, the following day, June 28, Bitcoin faced another setback. It opened at $30,078.6 and struggled to make significant gains. Despite reaching a peak of $30,703.4, the cryptocurrency closed at $29,919.5, marking a decline of 1.99%. The trading volume stood at 51.06K.
June 29 saw a reversal of fortunes as Bitcoin witnessed a positive turn. Opening at $30,445.7, it climbed to $30,823.1, demonstrating a gain of 1.22%. The trading volume for the day was 49.57K Bitcoin.
Bitcoin’s performance on June 30 remained relatively stable. Opening at $30,472.9, it experienced minor fluctuations before closing at $30,445.7. The cryptocurrency recorded a slight gain of 0.09%, with a trading volume of 118.65K.
As the month drew to a close, Bitcoin opened at $30,586.8 on July and maintained its momentum reaching a high of $30,649.9. It closed at $30,329.0, resulting in a loss of 0.37%. The trading volume during this period was 22.46K Bitcoin.
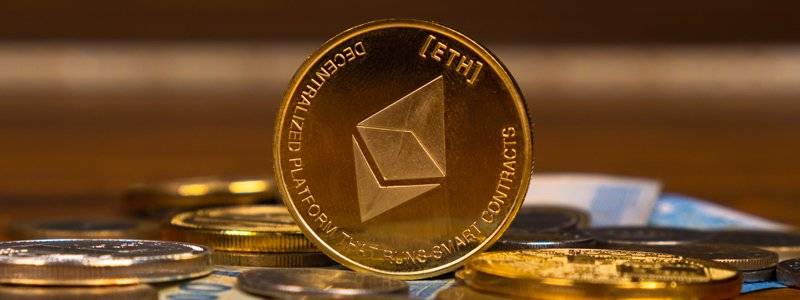
Ethereum (ETH)

Ethereum (ETH) opened at $1,898.80 and closed at $1,869.28 at the beginning of the week, representing a gain of 1.27% during the day.
However, June 26 witnessed a decline in Ethereum’s value, with the coin opening at $1,859.00 and closing at $1,840.63. This marked a decrease of 2.10%, leading to concerns among investors who were hoping for a stable and consistent growth.
The price volatility continued on June 27 when Ethereum experienced a rebound, opening at $1,889.51 and closing at $1,856.19. This surge of 1.64% provided some relief to investors, but the overall sentiment remained cautious due to the coin’s unpredictable performance.
June 28 saw another downtrend for Ethereum as it opened at $1,827.95 and closed at $1,821.94, resulting in a decline of 3.26%. Attempting to regain momentum, Ethereum opened on June 29 at $1,851.92 and closed at $1,827.95, representing a modest increase of 1.31%. This uptick provided a ray of hope. The end of the month brought a mixed bag of results for Ethereum. On June 30, the coin opened at $1,933.80 and closed at $1,837.49, recording a decline of 4.42% in a single day. This abrupt decrease alarmed investors, raising questions about the factors contributing to the coin’s volatility. As we approach the start of July, Ethereum opened on July 1 at $1,924.53 and closed at $1,909.92, resulting in a marginal decrease of 0.48%. The marginal decline, though relatively small, continued to cast doubt on Ethereum’s ability to find stability in the market.
Ripple (XRP)

Last week began on a positive note for Ripple, as it opened at a price of $0.49022 against the US dollar. The digital asset showed promise by climbing to $0.49696 before closing at $0.48312, marking a modest gain of 0.75%.
The optimism subsided as Ripple’s value took a sharp downturn the following day. The coin opened at $0.47908 but struggled to maintain its momentum. Despite briefly reaching $0.49161, XRP experienced a substantial decline, closing the day at $0.47320. This represented a decline of 2.27% in 24 hours.
Ripple’s rollercoaster ride continued on June 27th, as it rebounded from the previous day’s losses. Opening at $0.48380, XRP managed to climb to $0.48481 before settling at $0.47650, reflecting a modest gain of 0.98%. This slight recovery brought a sigh of relief to investors who were growing increasingly wary of the coin’s volatility.
However, the cryptocurrency’s upward momentum was short-lived. On June 28th, Ripple faced another setback, with its value plummeting significantly. Opening at $0.46466, XRP struggled to regain its footing and reached a high of $0.48432.
The following day brought some hope for Ripple enthusiasts, as the coin managed to reverse its recent trend and regain some lost ground. Opening at $0.47461, XRP climbed to $0.47720 before finally closing at $0.46149, marking a gain of 2.14%. This slight recovery instilled a sense of optimism among investors, who were eager to see if the positive momentum would continue.
The coin opened at $0.47293 but could not maintain its upward trend on the last day of the month. Despite briefly reaching $0.48260, XRP faced significant selling pressure and closed the day at $0.45445, experiencing a notable loss of 0.35%.
As the week came to a close, Ripple experienced another mixed day of trading. Opening at $0.47329, XRP faced a turbulent market. However, the coin managed to gain some ground and closed at $0.46484, resulting in a modest increase of 0.08%. This marginal growth may provide some stability to investors who have been closely monitoring Ripple’s erratic performance.
Cardano (ADA)

At the beginning of the week, Cardano opened at a price of $0.2920 and closed the day at $0.2885, witnessing a modest gain of 0.89%. However, this positive momentum was short-lived as the following days brought significant fluctuations to the coin’s value.
June 26 saw Cardano’s price drop to $0.2774, marking a decline of 3.94% from the previous day. The coin struggled to regain its footing, with prices reaching $0.2665 on June 29, showcasing a downward trend with a decrease of 6.94%.
Market sentiment shifted on June 30 as Cardano experienced a surge in trading volume, totaling 310.26 million ADA. This increase in trading activity, coupled with investor interest, pushed the price up to $0.2987, recording a gain of 4.21% in a single day. However, this upward trend was short-lived, and the price closed at $0.2717.
Despite the fluctuations, Cardano managed to stabilize on July 1, closing at $0.2869. Although the gain was modest at 2.01%, it provided a sense of stability amidst the recent price volatility.
Solana (SOL)

Solana opened the week at $16.964, with a trading volume of 3.45 million. The cryptocurrency saw a slight increase of 1.94%, reaching a high of $17.380, before settling at $16.573. This positive momentum sparked optimism among Solana investors, who eagerly anticipated future gains.
The following day, June 26, Solana experienced a downtrend. Opening at $16.262, the price dropped to $15.986, marking a decrease of 4.14%. The trading volume remained relatively stable at 3.98 million. Such a downturn puzzled investors, prompting questions about the underlying factors driving this significant drop.
As the week progressed, Solana’s price continued to fluctuate. On June 27, Solana rebounded, reaching $16.622, an increase of 2.21%. The trading volume decreased slightly to 3.85 million. Despite this positive movement, some investors remained cautious, skeptical about the stability of the upward trend.
The volatility persisted on June 28, as Solana opened at $15.965. It briefly rose to $16.648 before settling at $15.712, representing a decline of 3.95%. The trading volume stood at 5.32 million. These sudden and substantial price shifts added uncertainty to the market, leading investors to reevaluate their strategies.
June 29 witnessed another day of turbulence for Solana. Opening at $17.990, the cryptocurrency experienced a steep decline, hitting a low of $15.885, resulting in a significant drop of 12.68%. The trading volume remained relatively high at 9.57 million. This downward spiral triggered concerns among investors, as they sought to understand the catalysts behind such a sharp decline.
Despite the challenges faced earlier in the week, Solana managed to regain momentum on June 30. Opening at $18.858, the cryptocurrency experienced a notable increase of 4.83%. Solana reached a high of $19.930 before settling at $17.330. The trading volume surged to 13.57 million, reflecting heightened interest and activity in the market.
As Solana approached July 1, the coin’s price remained relatively stable. Opening at $18.719, Solana experienced a slight decline of 0.74%, settling at $17.919. The trading volume for the day was 4.08 million. This minor setback tempered the recent gains but did not deter investors from closely monitoring the cryptocurrency’s performance.
Litecoin (LTC)

On June 25, 2023, Litecoin opened at a price of $88.220. However, as the day progressed, the price dipped, reaching a low of $86.800. The trading volume for the day stood at 566.52K Litecoin units. This decline marked a negative sentiment for the cryptocurrency, further increasing the volatility in the market.
The preceding day, June 26, saw a marginal recovery in Litecoin’s price, but it still recorded a decrease of 1.17%. This decline came after a brief period of stability, following a larger drop on June 28th, when the coin lost 5.78% in value.
Investors had hoped for a reversal of fortunes when Litecoin closed at $108.660 on June 30th, showing a promising 28.27% gain. However, these gains proved to be short-lived, as the cryptocurrency market witnessed a significant sell-off. This sudden change in sentiment led to Litecoin’s decline on June 25th.
TRON (TRX)

On June 25, 2023, TRON started the week at a trading price of $0.073130. Throughout the week, the coin displayed a series of fluctuations, revealing the unpredictable nature of the crypto market. However, despite the volatility, TRON managed to finish the week on July 1, 2023, with a slight gain, trading at $0.077270.
The week started on a positive note for TRON as it opened at $0.073130 and recorded a 1.31% increase, closing at $0.072067 on June 25, 2023. This upward movement gave investors a glimmer of hope, setting the tone for the week ahead.
However, the following day, June 26, 2023, TRON experienced a brief setback. It opened at $0.073825 but closed at $0.072352, marking a 0.95% decline in value. Despite this setback, TRON enthusiasts remained optimistic, recognizing that price volatility is a common occurrence in the crypto world.
On June 27, 2023, TRON rebounded, opening at $0.074332 and closing at $0.073760, representing a 0.69% increase. This modest gain helped boost investor sentiment, reaffirming TRON’s resilience in the face of market uncertainty.
As the week progressed, TRON continued to exhibit mixed performance. On June 28, 2023, the coin experienced a small decrease, opening at $0.073747 and closing at $0.072733, resulting in a decline of 0.79%. The following day, June 29, 2023, TRON bounced back, opening at $0.074444 and closing at $0.073416, registering a 0.94% gain.
The penultimate day of the week, June 30, 2023, witnessed TRON facing another minor setback. It opened at $0.076196 and closed at $0.074200, reflecting a decrease of 2.35%. Nonetheless, investors remained undeterred, recognizing that short-term price fluctuations are an inherent part of the crypto market.
Finally, on July 1, 2023, TRON ended the week with a positive note. It opened at $0.076155 and closed at $0.077270, experiencing a gain of 1.41%. This upward movement instilled renewed confidence among TRON supporters, as the coin demonstrated its resilience by finishing the week on a high note.
The post Digital Asset Insights 04.07.23 first appeared on trademakers.
The post Digital Asset Insights 04.07.23 first appeared on JP Fund Services.
The post Digital Asset Insights 04.07.23 appeared first on JP Fund Services.


