So, you’re trying to get financial data, maybe for your own tracking or for a project. Google Finance can be a part of that, and knowing its specific attributes is pretty helpful. It’s not always obvious what data you can pull or how it works, especially when you’re trying to link it up with something like Google Sheets. We’ll break down the main googlefinance attributes list you’ll likely run into, what they mean, and how they might affect the information you get. Think of this as a quick guide so you don’t get lost in the weeds.
Key Takeaways
- Google Finance offers a simple way to get stock data, good for beginners or quick checks.
- The GOOGLEFINANCE function in Sheets is your main tool for pulling this data directly.
- Be aware that Google Finance data can sometimes have delays, especially compared to other services.
- It’s good for basic company info and stock prices, but might lack the depth for serious traders.
- Future updates might bring more AI features, but right now, it’s more about straightforward data access.
Understanding Google Finance Attributes
When you’re looking at financial data, especially for things like stocks or market trends, you need to know where that information comes from and how it’s presented. Google Finance has a set of attributes, which are basically labels or categories, that help organize and deliver this data. These attributes are the building blocks for understanding market movements and company performance. They dictate what kind of information you can pull, how up-to-date it is, and how you can use it, particularly within tools like Google Sheets.
Core Functionality and Data Access
At its heart, Google Finance aims to make financial information accessible. It pulls data from various sources and makes it available through specific attributes. Think of these attributes as different types of questions you can ask about a company or a market. For example, you can ask for the current stock price, the company’s total value (market cap), or its recent earnings. The platform is designed to provide these answers in a structured way, making it easier to track investments or research potential opportunities.
Integration with Google Ecosystem
One of the standout features of Google Finance is how it plays nicely with other Google products. This is especially true for Google Sheets. Many of the attributes available on Google Finance can be directly pulled into a spreadsheet using the GOOGLEFINANCE function. This means you don’t have to manually copy and paste data; it can update automatically. This integration is a big deal for anyone who likes to build custom dashboards or perform detailed analysis right in their spreadsheet.
User Interface Philosophy
Google Finance generally follows a clean and straightforward design. The idea is to present information without overwhelming the user. You won’t find the dense, news-heavy layout that some other financial sites have. Instead, it focuses on clarity and ease of use. This approach is great if you just need a quick look at stock prices or basic company details. It’s less about deep-dive analysis on the platform itself and more about providing the core data points you might need for further investigation elsewhere, like in a spreadsheet.
The platform’s design prioritizes a clear view of essential financial metrics, aiming to reduce clutter and make data retrieval less complicated for the average user. This focus on simplicity means that while core data is readily available, some advanced analytical tools might be less prominent or absent compared to more specialized financial platforms.
Key Google Finance Attributes for Data Retrieval
When you’re looking to pull financial information, Google Finance offers a set of attributes that make it possible. These attributes are like specific labels you use to ask for particular pieces of data about stocks, companies, and the broader market. Think of them as the keywords that tell Google Finance exactly what you need.
Stock Price Attributes
These attributes are all about the current and historical trading activity of a stock. They’re what most people think of first when they hear "stock data."
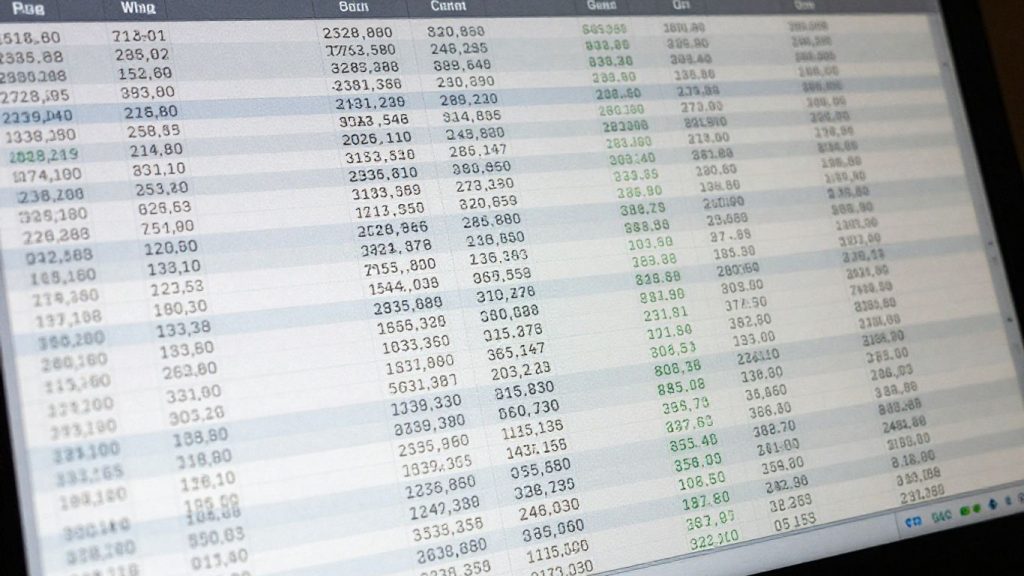
- Price: This is the most basic attribute, giving you the current trading price of a stock. It’s important to note that Google Finance’s ‘price’ attribute can have a delay of up to 20 minutes.
- Open: The price at which a stock began trading for the day.
- High: The highest price a stock reached during a trading period (e.g., the day or a specific historical period).
- Low: The lowest price a stock reached during a trading period.
- Volume: The total number of shares traded during a specific period.
- Change: The difference between the current price and the previous day’s closing price.
While Google Finance provides these core price attributes, it’s worth remembering that for truly real-time, tick-by-tick data, especially for active trading, other platforms might offer faster updates. Google’s approach often involves data aggregation, which can introduce a slight lag.
Company Information Attributes
Beyond just the price, you might want to know more about the company itself. These attributes provide that background.
- Name: The full legal name of the company.
- Symbol: The unique ticker symbol used to identify the company on an exchange (e.g., GOOG for Alphabet Inc.).
- Exchange: The stock exchange where the company’s shares are primarily traded (e.g., NASDAQ, NYSE).
- Industry: The sector or industry the company operates within.
- CEO: The name of the company’s Chief Executive Officer.
Market Data Attributes
These attributes give you a broader view of the market, not just a single stock.
- Market Cap: The total market value of a company’s outstanding shares (calculated by multiplying the current share price by the total number of shares).
- 52-week High/Low: The highest and lowest prices a stock has traded at over the past 52 weeks.
- Dividend Yield: The ratio of a company’s annual dividend per share to its current market price per share, expressed as a percentage.
- PERatio (Price-to-Earnings Ratio): A valuation metric that compares a company’s current share price to its earnings per share. It indicates how much investors are willing to pay for each dollar of earnings.
Leveraging Google Finance Attributes in Google Sheets
Google Sheets offers a direct pathway to integrate financial data using the GOOGLEFINANCE function. This built-in tool lets you pull a wide array of financial information directly into your spreadsheets, making it a practical choice for personal finance tracking or basic market analysis without leaving your familiar workspace.
The GOOGLEFINANCE Function Explained
The GOOGLEFINANCE function is your primary gateway to accessing financial data within Google Sheets. Its syntax is straightforward, allowing you to specify the ticker symbol, the attribute you want to retrieve, and optionally, a start and end date for historical data. This function is particularly useful for creating custom dashboards or performing simple calculations on market data.
The basic structure is: =GOOGLEFINANCE("ticker", "attribute", [start_date], [end_date], [interval])
Here’s a quick look at some common attributes:
- `
Attribute Specifics and Data Latency Considerations
When you’re pulling financial data, especially for active trading or time-sensitive analysis, understanding how quickly that data updates is pretty important. It’s not always as simple as just getting the latest number. Different sources and how they process information can lead to delays, and these delays can matter.
Understanding Data Refresh Rates
Google Finance, like many financial data providers, doesn’t always give you the absolute second-by-second tick. The data you see might be delayed, sometimes by a few minutes, sometimes more. This is often because the data is aggregated from various exchanges and then processed. For casual checking, this is usually fine. But if you’re trying to make a quick trade based on a price movement, even a 15-minute delay can be a problem. Some exchanges might offer real-time data, while others have a built-in lag.
Here’s a general idea of what to expect from some European exchanges:
| Exchange | Delay (minutes) |
|---|---|
| London Stock Exchange | Realtime |
| Deutsche Börse XETRA | 15 |
| Euronext Paris | 15 |
| SIX Swiss Exchange | 15 |
| Borsa Italiana Milan | Realtime |
| Bolsas y Mercados Españoles | 15 |
The ‘price’ attribute in Google Finance itself notes a potential delay of up to 20 minutes. This means that while it’s "real-time" in a broad sense, it’s not instantaneous.
Impact of Data Aggregation on Latency
Think of it like this: Google Finance pulls data from many different places. Each place might have its own speed for sending out information. Then, Google’s systems have to collect all that, sort it, and present it. This whole process adds time. It’s different from a platform that might have direct feeds from fewer, but perhaps more critical, exchanges. This aggregation is what allows Google Finance to offer a wide range of data, but it’s also a source of potential delays.
For investors managing portfolios across different countries, the varying speeds at which data arrives from various international markets can be a significant factor. What’s instant in one region might be noticeably delayed in another, complicating the picture for global analysis.
Attribute Limitations and Delays
It’s good to be aware that not all attributes are created equal when it comes to speed. While price data might have a certain delay, other information, like company fundamentals or news, might update on a different schedule altogether. You might find that a stock price looks current, but the related news is from yesterday. Always check the context of the data you’re using. For active traders, this means platforms that offer more direct, faster feeds might be a better fit, even if they have a simpler interface. Google Finance tends to be more geared towards general information and portfolio tracking rather than high-frequency trading needs.
Advanced Google Finance Attributes and Future Potential
While Google Finance currently offers a solid foundation for tracking market data, its future looks even more interesting, especially with the integration of advanced technologies. The platform is evolving beyond just presenting numbers; it’s aiming to become a more intelligent financial assistant.
Exploring Emerging AI-Driven Features
Google is actively working on incorporating its powerful Artificial Intelligence capabilities, like the Gemini models, into Google Finance. This isn’t just about making the interface look slick; it’s about providing users with deeper insights and a more contextual understanding of financial information. Imagine asking complex questions about market trends or company performance in plain language and getting clear, cited answers. This move signals a shift from raw data delivery to intelligent analysis.
Integration with Prediction Markets
Looking ahead, Google Finance is exploring the integration of data from prediction markets. Platforms like Kalshi and Polymarket allow users to trade on the outcomes of future events. Bringing this data into Google Finance could offer a unique perspective on market sentiment and potential future price movements, adding another layer for sophisticated analysis.
Future Enhancements for Financial Research
Beyond AI and prediction markets, several other enhancements are on the horizon. These include:
- Deep Search Functionality: A more advanced search that can understand nuanced financial queries and pull information from various credible sources.
- Live Earnings Call Transcripts: Real-time streaming of earnings calls, complete with AI-generated summaries and transcriptions, making it easier to digest key information.
- Conversational Analysis: The ability to interact with the platform in a more natural, conversational way to explore financial data and research.
The direction Google Finance is heading suggests a move towards a more proactive and insightful financial tool. It aims to assist users not just in finding data, but in understanding its implications and potential future impacts. This evolution is particularly exciting for those who want more than just basic stock quotes and charts.
Comparing Google Finance Attributes with Competitors
When you’re looking at financial data, it’s not just about what information you can get, but also how fast and how reliably you get it. Google Finance has its strengths, especially if you’re already using Google Sheets, but when you stack it up against other big names like Yahoo Finance, some differences really stand out. It’s like comparing a reliable sedan to a sports car – both get you there, but the experience and speed are quite different.
Attribute Differences: Google vs. Yahoo Finance
Yahoo Finance has been around for a while, and it’s built a reputation for being a go-to source for a lot of investors. Its platform often feels more like a busy newsroom, packed with data, charts, and breaking news. Google Finance, on the other hand, tends to be cleaner, simpler, and more focused on core data. This difference in approach means they offer slightly different things.
- Data Refresh Speed: Yahoo Finance generally updates stock prices faster, which is a big deal if you’re trying to make quick trading decisions. Google Finance can have a delay, sometimes up to 20 minutes for certain ‘real-time’ quotes.
- User Interface: Google Finance offers a minimalist dashboard, great for beginners or quick checks. Yahoo Finance has a more detailed, newsroom-style layout that’s packed with information, which serious investors might prefer.
- Extended Hours Data: For pre-market and after-hours trading, Yahoo Finance usually provides more detailed and timely information compared to Google Finance.
The choice between these platforms often comes down to what you prioritize: simplicity and integration with the Google ecosystem, or a wealth of detailed, rapidly updating market information.
Data Speed and Accuracy Comparisons
This is where things can get pretty important for active traders. The speed at which you get market data can directly impact your investment outcomes. A few seconds can make a difference. Yahoo Finance often leads the pack here, providing updates that feel almost instantaneous for major stock exchanges. This makes it a favorite for those who need to react to market shifts right away.
Google Finance, by pulling data from various places, can sometimes introduce a bit of lag. While it’s perfectly fine for casual checking or long-term tracking, it might not be the best choice if you’re making time-sensitive trades. Accuracy is generally good on both, but the timeliness of that accuracy is where Yahoo often has an edge.
Charting and Technical Analysis Attributes
When you’re looking at charts, you want tools that help you see patterns and trends. Yahoo Finance offers quite robust charting tools. You can get full-screen charts, add a bunch of technical indicators, draw lines, and even compare multiple stocks on the same graph. It’s designed for people who do a lot of technical analysis.
Google Finance’s charts are simpler. They’re good for getting a basic idea of how a stock has performed over time, and they include some common indicators. However, they don’t have the same depth or customization options as Yahoo Finance. For serious technical analysis, you might find Google’s charting features a bit too basic.
Wrapping Up: Choosing Your Financial Data Partner
So, we’ve looked at how Google Finance and Yahoo Finance stack up. Google Finance is pretty straightforward, good for quick checks and if you’re already using other Google tools. It’s simple, clean, and gets the job done for basic tracking. On the other hand, Yahoo Finance packs in a lot more detail. It’s got faster updates, more advanced charts, and better news integration, which really helps if you’re actively trading or doing deep dives into the market. The best choice really comes down to what you need. If you want a simple way to keep an eye on things, Google Finance might be your pick. But if you need that real-time, detailed information to make quick decisions, Yahoo Finance seems to be the way to go. Both platforms are still evolving, especially with AI on the horizon, so it’s worth keeping an eye on how they change.
Frequently Asked Questions
Which finance tool is easier for someone just starting out?
Google Finance is usually better for folks who are new to investing. It has a simple look and is easy to get around. Beginners can check stocks and see basic charts without getting confused by too much information. This makes it a great place to begin learning about the stock market.
Do I have to pay to use Google Finance or Yahoo Finance?
Nope, both of these tools let you use their main features for free. You can check live data, make lists of stocks you want to watch, and use charting tools without paying. Yahoo Finance does have a paid version with more advanced features, though.
Is the live data on both sites accurate enough for trading?
Yahoo Finance is known for having data that updates almost instantly, which is great for active traders. Google Finance pulls its data from different places, so there might be small delays sometimes. For quick trading decisions, many investors trust Yahoo Finance more because it’s usually faster and more dependable.
Which app is better if I want to check stocks on my phone?
For people who are serious about investing, the Yahoo Finance app is the better choice. It has lots of features, like advanced charts and news, all in a well-designed app. Google Finance doesn’t have its own app; you use its website on your phone, which has fewer features for checking things on the go.
Can I get alerts if a stock price changes a lot?
Yahoo Finance makes it easy to set up alerts for when a stock hits a certain price. You can choose how you want to be notified, like by email or text. Google Finance doesn’t have this feature built-in as easily. You’d have to use Google Alerts separately to get news about specific companies, which isn’t as direct for price changes.
Does Google Finance have delays for international stock prices?
Yes, Google Finance can have delays for stock prices from different countries. Some markets might show real-time prices, but others could have a delay of about 15 minutes. Yahoo Finance tends to be more consistent with its speed across many global markets.

Peyman Khosravani is a global blockchain and digital transformation expert with a passion for marketing, futuristic ideas, analytics insights, startup businesses, and effective communications. He has extensive experience in blockchain and DeFi projects and is committed to using technology to bring justice and fairness to society and promote freedom. Peyman has worked with international organizations to improve digital transformation strategies and data-gathering strategies that help identify customer touchpoints and sources of data that tell the story of what is happening. With his expertise in blockchain, digital transformation, marketing, analytics insights, startup businesses, and effective communications, Peyman is dedicated to helping businesses succeed in the digital age. He believes that technology can be used as a tool for positive change in the world.