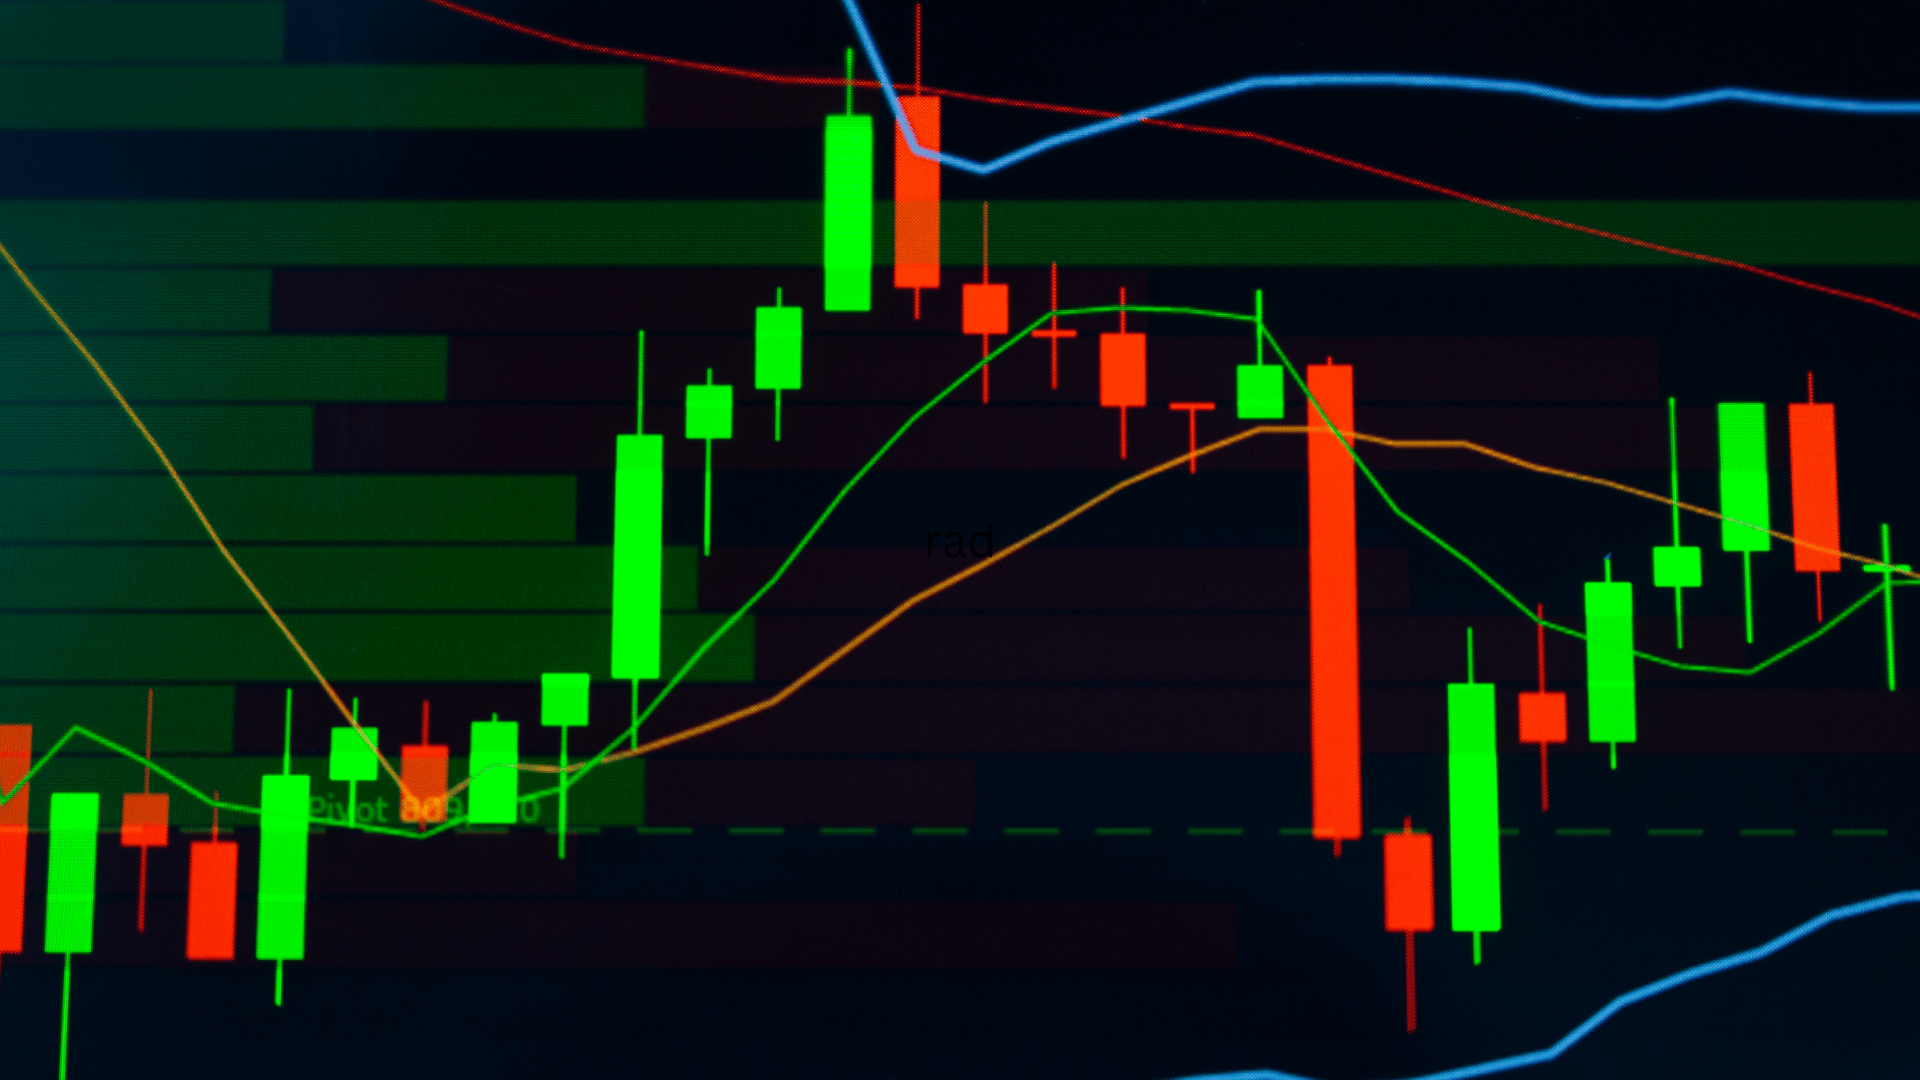
The bearish harami might seem like an old-school concept. But surprisingly, this humble two-candle pattern still finds its place in today’s high-speed, data-rich financial world. It continues to offer subtle, early warnings of a potential shift in sentiment—particularly when prices have been pushing upward with strength.
So, what makes the bearish harami so persistent in a market dominated by algorithms and automation? Its value lies in simplicity. It’s not about making complex predictions; it’s about recognizing moments when momentum hesitates. That hesitation can be the very clue that a trend is starting to lose steam.

Understanding the Bearish Harami Pattern
At its core, the bearish harami is a candlestick formation that consists of two candles:
- The first is a large bullish candle that shows strength and optimism.
- The second is a smaller bearish candle that fits entirely within the body of the first one.
Visually, it looks like the second candle is being “swallowed” or “contained” by the first, which is exactly where the term harami (meaning “pregnant” in Japanese) comes from.
What this pattern reflects is a pause—a point where buyers slow down and sellers begin to test the waters. It’s not dramatic, but that’s what makes it interesting. In the fast-moving digital markets we have today, subtlety still has a lot to say.
Why It Still Works in a Technology-Driven World
You might think a candlestick pattern from decades ago has no place among smart algorithms and machine learning models. But that’s not true. In fact, many of those models actively look for patterns like the bearish harami as part of their signal-generating toolkit.
The reason? It continues to provide insight into short-term psychology. No matter how fast markets move or how complex the infrastructure becomes, patterns based on human behavior—and especially hesitation—tend to repeat themselves.
Even platforms using natural language processing or AI to scan news headlines still rely on price action to confirm sentiment. That’s where the bearish harami fits in. It reflects a quiet contradiction between what the market has been doing and what it might do next.
When Is the Bearish Harami Most Useful?
While this pattern can appear across all types of markets—stocks, crypto, forex—it tends to be more reliable in certain conditions.
- After an extended rally: If the market has been climbing steadily, a bearish harami can suggest that the upward pressure is weakening.
- Near resistance levels: If price approaches an area that previously caused selling, the pattern becomes more meaningful.
- On daily or weekly charts: Short-term charts are filled with noise. Longer timeframes give this pattern more significance.
What’s important is not just spotting the harami but asking the right questions about it. Where is it forming? What’s the recent price history? Is volume confirming the slowdown?
Human Behavior Behind the Pattern
Price patterns aren’t just data—they’re behavior made visible. The first candle in a bearish harami shows excitement, momentum, and confidence. The second candle shows hesitation, doubt, and a potential shift in sentiment.
In real terms, that might look like a company announcing strong earnings, followed by news that raises future uncertainty. The market reacts with a strong move upward (the first candle), then closes weakly the next day (the second candle). That’s the psychology you’re watching.
This is why the bearish harami works for both discretionary traders and systems traders. One sees hesitation. The other sees a formation. Both respond.
The Role of Algorithms and Automation
Technology hasn’t replaced the pattern—it has enhanced it. Modern platforms use real-time pattern detection to scan for bearish haramis instantly. They combine this recognition with other data: volume, trend direction, even keyword sentiment analysis.
This automation makes it possible to monitor thousands of instruments at once. And while no system is perfect, the ability to detect subtle shifts—like those shown by a bearish harami—can trigger alerts that help traders pause, reevaluate, or tighten risk controls.
It’s not about blindly following the pattern. It’s about using it in a larger framework. Algorithms do that. So should humans.
Interpreting It in Real-Life Situations
Let’s say a popular tech stock has been on a steady uptrend for a few weeks. It breaks above a key resistance level and closes strong one day. The next day, however, it opens lower and closes slightly negative—within the body of the previous candle.
That’s your bearish harami.
Now, you won’t want to panic. But it’s a signal worth watching. The next candle could confirm the shift. Or, it might fizzle out. Either way, your response should be grounded in observation, not reaction.
By layering in what you know—volume changes, macro news, recent earnings—you begin to interpret the pattern with more clarity. That’s the kind of decision-making that builds experience.
Calculating Risk Around a Bearish Harami
The pattern itself doesn’t give a numerical value, but it helps frame your trade:
- If you’re long, you might consider tightening your stop just below the low of the second candle.
- If you’re shorting, you may look for a confirmation candle before entry.
- Risk-reward still applies. Let the context shape your approach.
The real key is understanding that no pattern guarantees outcome. What it gives you is a reason to pause and reassess your position.
Conclusion
The bearish harami might seem quiet in its message, but that’s exactly why it matters. It’s not a loud reversal signal. It’s the calm before a potential shift. And in a market that’s constantly moving, those subtle pauses can often say the most.
Even as technology races ahead—using AI, automation, and real-time scanning—this classic pattern continues to hold its place. When platforms like Alchemy Markets integrate real-time pattern detection, they do so because these signals, however simple, still carry weight.
Ultimately, it’s not just about recognizing the pattern. It’s about understanding its context, combining it with data, and using it as part of a thoughtful strategy. That’s how modern traders, no matter their tools, stay a step ahead.
FAQs About the Bearish Harami
Can I Rely on the Bearish Harami Alone?
Not really. While it’s useful, it works best as part of a bigger picture. Use it with support/resistance levels, volume trends, and momentum indicators. It’s a heads-up, not a guarantee.
How Does It Compare to the Bearish Engulfing Pattern?
The bearish engulfing is stronger and more aggressive. It signals immediate rejection. The bearish harami is quieter—more of a warning than a statement. But in some cases, that whisper carries more weight than a shout.
Should New Traders Learn This Pattern?
Absolutely. It’s simple, visual, and easy to practice identifying. For beginners, it’s also a great way to get used to how sentiment shows up in price action.
What Timeframe Should I Use?
Daily charts often show more reliable harami patterns, especially after a clear trend. Shorter timeframes can produce false signals due to market noise.
Does It Work with Wave Theory?
Yes. If you’re studying wave counts, such as in an Elliott Wave course, the bearish harami often appears toward the end of corrective moves or as a signal that a motive wave may be losing power. It offers a small but helpful clue in identifying shifts in structure.

Peyman Khosravani is a global blockchain and digital transformation expert with a passion for marketing, futuristic ideas, analytics insights, startup businesses, and effective communications. He has extensive experience in blockchain and DeFi projects and is committed to using technology to bring justice and fairness to society and promote freedom. Peyman has worked with international organizations to improve digital transformation strategies and data-gathering strategies that help identify customer touchpoints and sources of data that tell the story of what is happening. With his expertise in blockchain, digital transformation, marketing, analytics insights, startup businesses, and effective communications, Peyman is dedicated to helping businesses succeed in the digital age. He believes that technology can be used as a tool for positive change in the world.


