


While the fundamentals that surround cryptocurrencies are difficult to determine, what is clear is presently that demand is exceeding supply. One of the best ways to pinpoint the supply versus demand dynamic in the digit currency market, is to use technical indicators to trade the crypto currency market . Indicators can include momentum as well as trend following indicators.
Trend Following
A trend following strategy is one where you are looking to ride a trend, and attempting to find and indicator that will signal that you are in the beginning to middle of a trend. One of the most efficient trend following indicators is the moving average crossover.
What is a Moving Average
A moving average is the average of the price of a security over a specific period. For example, a 10-day moving average is the average of the last 10-days. On day 11, the first day drops out of the average calculation.
Moving Average Crossover Strategy
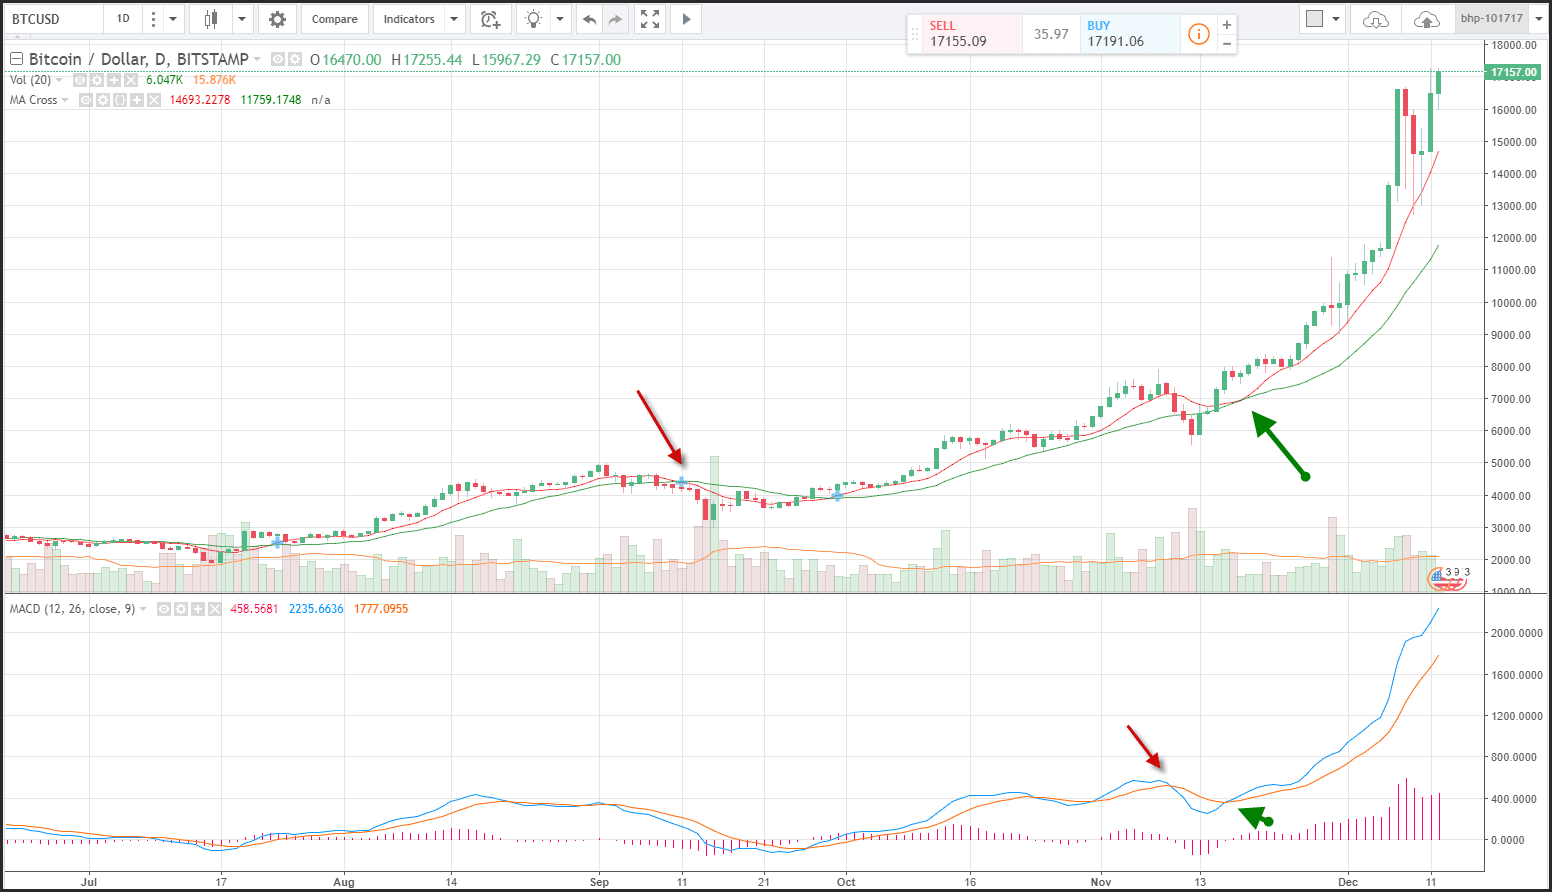
The moving average crossover strategy alerts you to purchase bitcoin when the short term moving average crosses above the longer term moving average. In the chart below this is designated by the green arrow, in the upper portion of the chart. When the short term moving average crosses below the longer term moving average, which is designated by the red arrow, the trend is deemed to have turned lower. One of the issues you might face with a moving average crossover strategy is that the crossover usually happens in the middle of a trend.
The initial move could be against the direction of the trend, and will require patience. Additionally, when bitcoin is consolidating, the moving average crossover indicator could generate many false signals. You should expect to lose more than you win with a moving average crossover strategy but when you win, you earn much more than you lose.
Momentum
Momentum strategies attempt to describe when a market is accelerating or decelerating. One of the best momentum indicators is the MACD (moving average convergence divergence) index created by Gerald Appel. The MACD uses the spread between 2-different moving average to determine accelerating or decelerating momentum. As the difference increases (the short term moving average is diverging away from the long term moving average), bitcoin prices are accelerating. As the difference between the shorter term moving average and a longer term moving average converges, momentum is decelerating. The MACD compares the 12-day and 26-day moving average differential, which is called the MACD index, and compares it to a moving average of the MACD index which is called the MACD signal line.
When the MACD line generates a crossover buy signal (which is designated by the green arrow in the lower part of the chart, momentum is accelerating higher. When the MACD line generates a crossover sell signal (which is designated by the red arrow in the lower part of the chart), negative momentum is accelerating.
You can also combine the MACD and the moving average crossover strategy to generate a trading strategy that works best for you. By using technical indicators, you will have a better way to gauge the future direction of bitcoin.


