


Wealth. So much power in this world, so much underlying factors and I would say so much emotions.
What does ‘wealth’ hide from us nowadays? Are we on a right path to balance inequality and reduce poverty? As per the latest report form the leading world institutions, the gap is even bigger today.
“Top 1 % own more than half of world’s wealth”, Credit Suisse
Thus, considering this unpromising statement of the Credit Suisse, we would like to look at some key points from its recent report on global wealth.
Understanding global wealth is useful. Credit Suisse has created a handy global wealth databook to help with this. The book is very comprehensive and includes up to date information on global wealth across all areas and levels. The book has been produced since the year 2000, and the goal is to provide information in the area of:
“The distribution within and across nations of individual net worth, defined as the marketable value of financial assets plus non financial assets (principally housing and land) less debts.”
Credit Suisse takes three steps in gathering the data needed. The first step involves determining the average wealth for each country. It uses the household balance sheet, which it gets from 48 different countries. The countries covered include 66% of the world’s people and 96% of the complete global wealth. Following this, the second step looks at the distribution of wealth in nations. This information is available for 31 different countries, and the organisation has found that there is a link between wealth distribution and income distribution. This enables Credit Suisse to predict everything out for 135 more countries in total. However, regular sources of wealth distribution are insufficient. They use the third step to get over this problem, utilising the Forbes rich lists and other similar types of lists to get to the bottom of wealth distribution in the highest wealth levels. Despite all of this it is still hard to get information for 50 different countries. It is argued that many of these countries are very small like Andorra and Monaco, or not that included in the global economy, such as Cuba, and Afghanistan.
Key Points
The Global Wealth Pyramid.
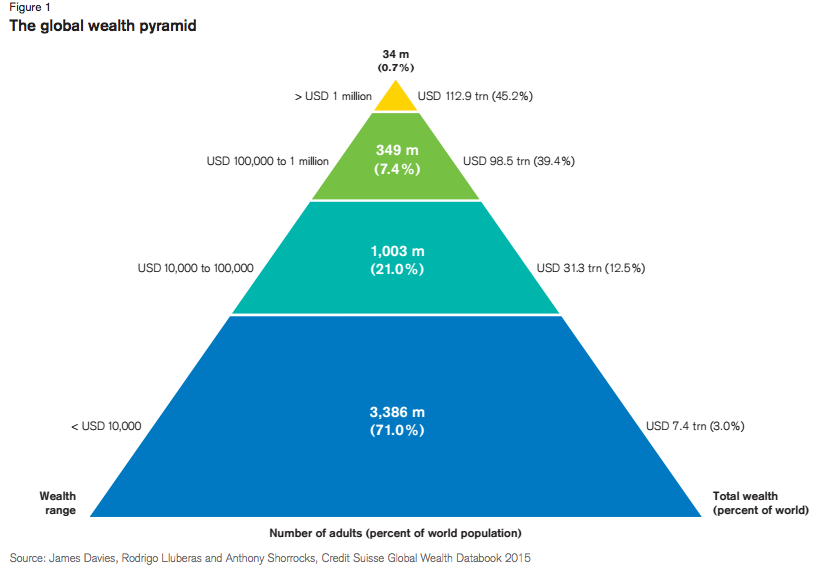
Source: Global Wealth Report 2015, Credit Suisse
As you can see there is a base of the pyramid, mid-range of 10,000-100,000 and above 100,000 and the top that represents less than 1% but owns wealth of over 1 million. The latter group is called High Net Worth. However, this is not the top of the pyramid. The top of the pyramid is called Ultra High Net Worth which includes millionaires with over 50 million wealth.
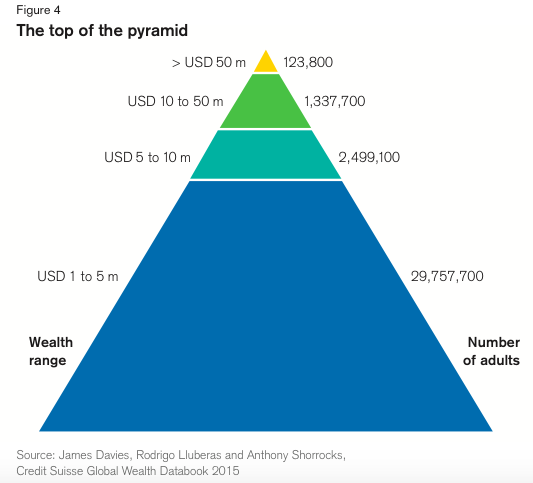
Source: Global Wealth Report 2015, Credit Suisse
The report suggests that number of UHNW is 123, 800, with 44, 900 worth at least USD 100 million and 4,500 have assets above USD 500 million. There are fluctuations in number of millionaires due to various factors, such as financial crisis, currency fluctuations, but the latest research suggests a small increase in the number of individuals owning more than USD 500 millions.
Regional rankings are dominated by North America with 61,300 (50%) UHNW residents, while Europe has 29,900 (24%) and Asia Pacific – 15,900 (13%). United States leads the country ranking followed by China (up 1,800 on the year) and then UK (5,400 up 400) which switched places with Germany (4,900 down 1,000).
Economic impact
All this data just reflect current wealth situation, but how will it change in future and what impact will it bring on global economy?
It is important to pay attention not only to the top of the pyramid, but also to the id-range as it represents USD 39 trillion of household wealth. Thus, this range has considerable economic importance and addressing the needs of these asset owners can drive new trends in financial industry. The country with growing potential in this category represent China, Korea, Taiwan and India. However, the top segment will likely continue to be the main driver of private asset flows and investment trends.
Global wealth by 2020
The report suggest that wealth growth will pick up by the end of the decade, reaching USD 345 trillion b mid-202, 38% higher than in 2015. Middle segment of wealth holders will exceed 1.3 billion adults, 40.3% of whom will be from China. In total, the number of millionaires will grow to 49.3 million adults.
The undisputed leader, United States, will remain on its position with wealth nearing USD 113 trillion, but its share will decline somewhat to a third of the global total. In the next five years, wealth growth in Europe will likely outpace the growth rate of the US, but the regional total will still fall short of the United States. Switzerland, followed by New Zealand, will remain as the world’s number one in terms of wealth per adult.
High-income economies will continue to be outpaced by emerging markets, 9.1% against 6.1%. In low-income and middle-income economies in emerging markets, wealth is expected to grow at 10.5% and 8.9% respectively. As a result, these economies could increase their share to 19% in 2020 and could together exceed USD 24.5 trillion, excluding India and China. Regarding China and India, they both will likely record growth levels above 9% and together in the next five years their share could rise by 11.9%. China alone might outpace France and Germany household wealth.
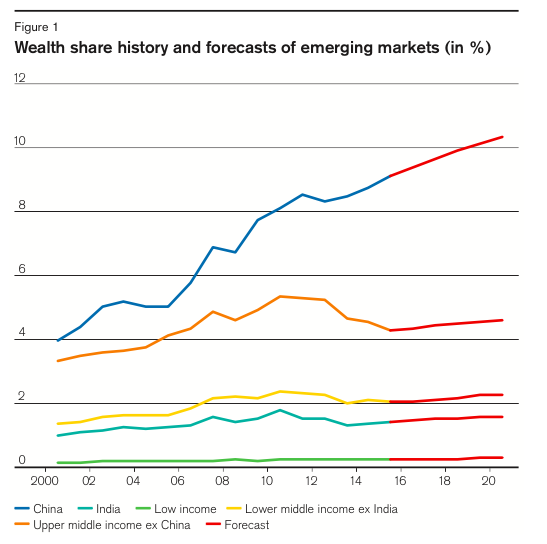
Source: Global Wealth Report 2015, Credit Suisse
Report limitations
Some challenges do exist with the data. One is choosing the right analysis unit. Sometimes it may seem that households or families are the most appropriate approach, but the problem is that in fact most assets are owned by specific individuals within those households. If those individuals leave those households then they may take their assets with them. Additionally, Credit Suisse points out that household members do not all have an equal say in how assets are managed, or they also may not share all of the funds equally if it is sold. Also, another complex factor in this is that people come and go in households. Specifically it is explained that older children may live away from home. The situation for this is not comparable across countries, with some children staying at home for longer.
Where there is no data on wealth the organisation uses econometric techniques to calculate per capita wealth levels. They are able to achieve estimated wealth values for 174 countries in this way, which in total accounts for 97% of the global population in 2015. However, ultimately there are 38 countries left over for which data is not available. This makes up 3% of the world’s population as of 2015. The organisation has to use a rather basic technique to deal with this challenge, of using the mean wealth for adults in the region, and the income class too. Clearly this is flawed but it is considered to be a superior approach than just ignoring the countries altogether. Wealth levels in some countries can be found for the most recent years, but many countries do not have data for 2012 to 2015.
HedgeThink.com is the fund industry’s leading news, research and analysis source for individual and institutional accredited investors and professionals


